GBP/USD Forecast: Pound could extend correction above 1.1550
- GBP/USD has managed to erase a portion of Tuesday's losses.
- Core inflation in the UK edged higher to 6.3% on a yearly basis in August.
- Wall Street's main indexes remain on track to open higher.

GBP/USD has gathered recovery momentum and climbed toward 1.1550 after having declined below 1.1500 earlier in the day. The pair needs to clear 1.1550 in order to attract bulls.
The data published by the UK's Office for National Statistics (ONS) reported on Wednesday that the annual Consumer Price Index (CPI) declined to 9.9% in August from 10.1% in July. The Core CPI, however, which excludes volatile food and energy prices, rose to 6.3% from 6.2%.
According to Reuters, UK interest rate futures point to a 79% chance that the Bank of England will raise its policy rate by 75 basis points to 2.5% on September 22 after the inflation data.
On Tuesday, hot inflation figures from the US triggered an impressive rally in the US Dollar Index (DXY) and forced GBP/USD to suffer large losses.
Early Wednesday, US stock index futures are up between 0.5% and 0.6% on the day. In case risk flows start to dominate the financial markets in the second half of the day, the greenback could face additional selling pressure. At the time of press, the DXY was down 0.2% on the day at 109.60.
The US economic docket will feature the August Producer Price Index (PPI) data. On a yearly basis, PPI is forecast to decline to 8.8% from 9.8% in July. Although investors are unlikely to overreact to producer inflation data, an unexpected increase in PPI could help the dollar regather strength and limit GBP/USD's upside.
GBP/USD Technical Analysis
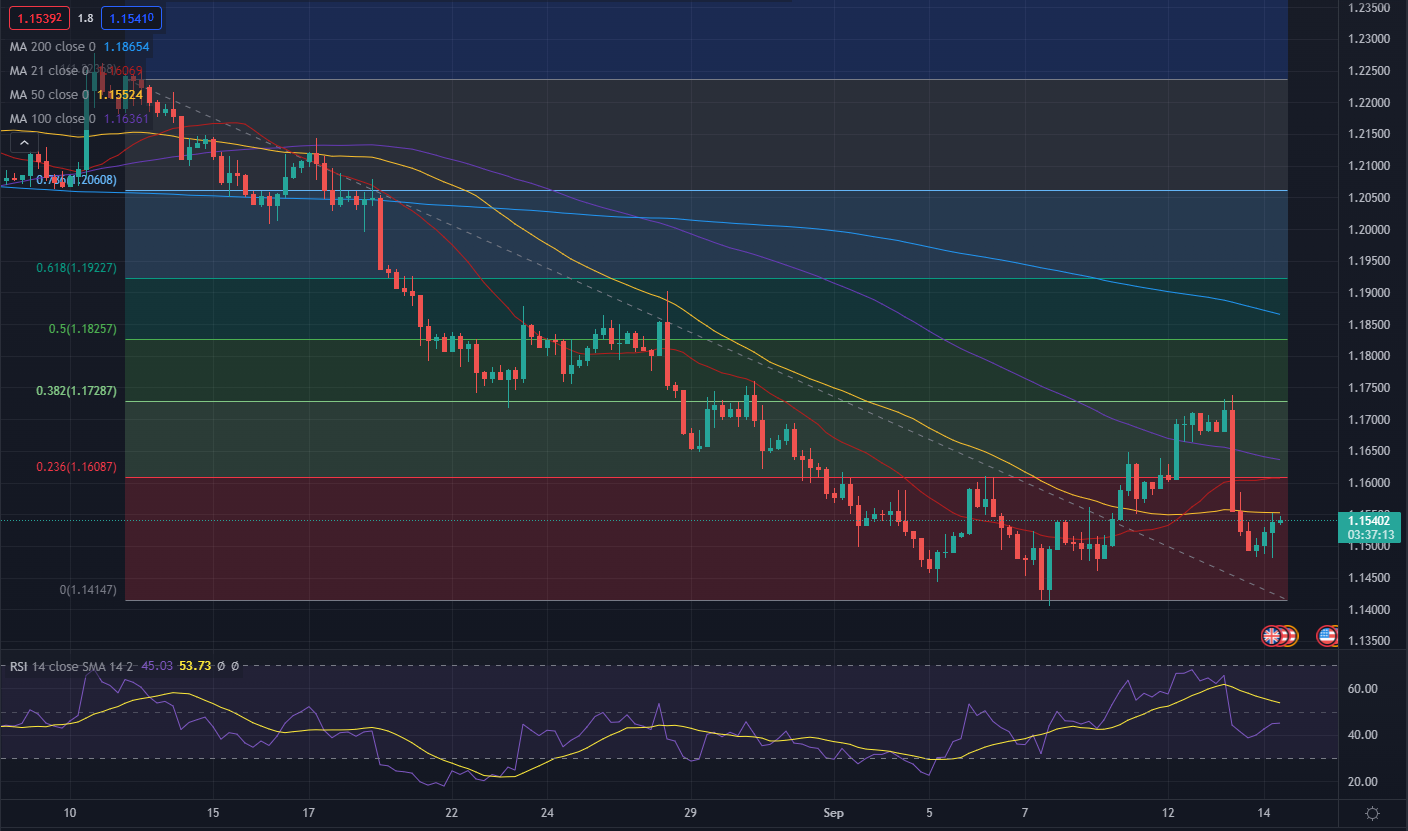
On the four-hour chart, the Relative Strength Index (RSI) indicator rose toward 50 during the European session, suggesting that sellers are moving to the sidelines. GBP/USD is trading within a touching distance of 1.1550, where the 50-period SMA is located. In case the pair flips that level into support, it could push higher toward 1.1600 (Fibonacci 23.6% retracement of the latest downtrend, 20-period SMA), 1.1640 (100-period SMA) and 1.1700 (psychological level).
On the downside, 1.1500 (psychological level) aligns as key support before 1.1450 (static level) and 1.1400 (end-point of the downtrend, psychological level).
Premium
You have reached your limit of 3 free articles for this month.
Start your subscription and get access to all our original articles.
Author

Eren Sengezer
FXStreet
As an economist at heart, Eren Sengezer specializes in the assessment of the short-term and long-term impacts of macroeconomic data, central bank policies and political developments on financial assets.


