GBP/USD Forecast: Next bullish target aligns at 1.2360
- GBP/USD has gained traction following a quiet Asian session.
- Technical outlook shows the bullish bias stays intact despite overbought conditions.
- Investors eye the US November jobs report for the next catalyst.

After having spent the Asian session consolidating Thursday's impressive gains near 1.2250, GBP/USD has gained traction and started to stretch higher toward 1.2300. Although the pair's near-term technical outlook points to overbought conditions, additional gains are likely after the US November jobs report.
On Thursday, the disappointing November ISM Manufacturing PMI report, which showed a contraction in the economic activity alongside a deceleration in input price inflation, weighed heavily on the US Dollar. Moreover, the US Bureau of Economic Analysis announced that the annual Personal Consumption Expenditures (PCE) Price Index declined to 6% in October from 6.3% in September, not allowing the USD to find demand.
According to the CME Group's FedWatch Tool, markets are pricing in a 79.5% probability of a 50 basis points (bps) Federal Reserve rate hike in December.
Later in the session, the US Bureau of Labor Statistics is forecast to report a 200,000 increase in Nonfarm Payroll (NFP) in November. In October, NFP came in at 261,000, compared to the market consensus of 200,000, but failed to provide a boost to the US Dollar as investors reacted to the decline in wage inflation. Average Hourly Earnings dropped to 4.7% on a yearly basis from 5% in September.
Hence, market participants are likely to pay closer attention to the annual wage inflation, which is projected to edge lower to 4.6%, component rather than the headline NFP print. A lower-than-expected Average Hourly Earnings figure should cause the US Dollar to stay under selling pressure heading into the weekend and help GBP/USD gather bullish momentum. On the other hand, strong wage inflation combined with a significantly higher-than-forecast NFP growth could force the pair to erase a portion of its weekly gains.
GBP/USD Technical Analysis
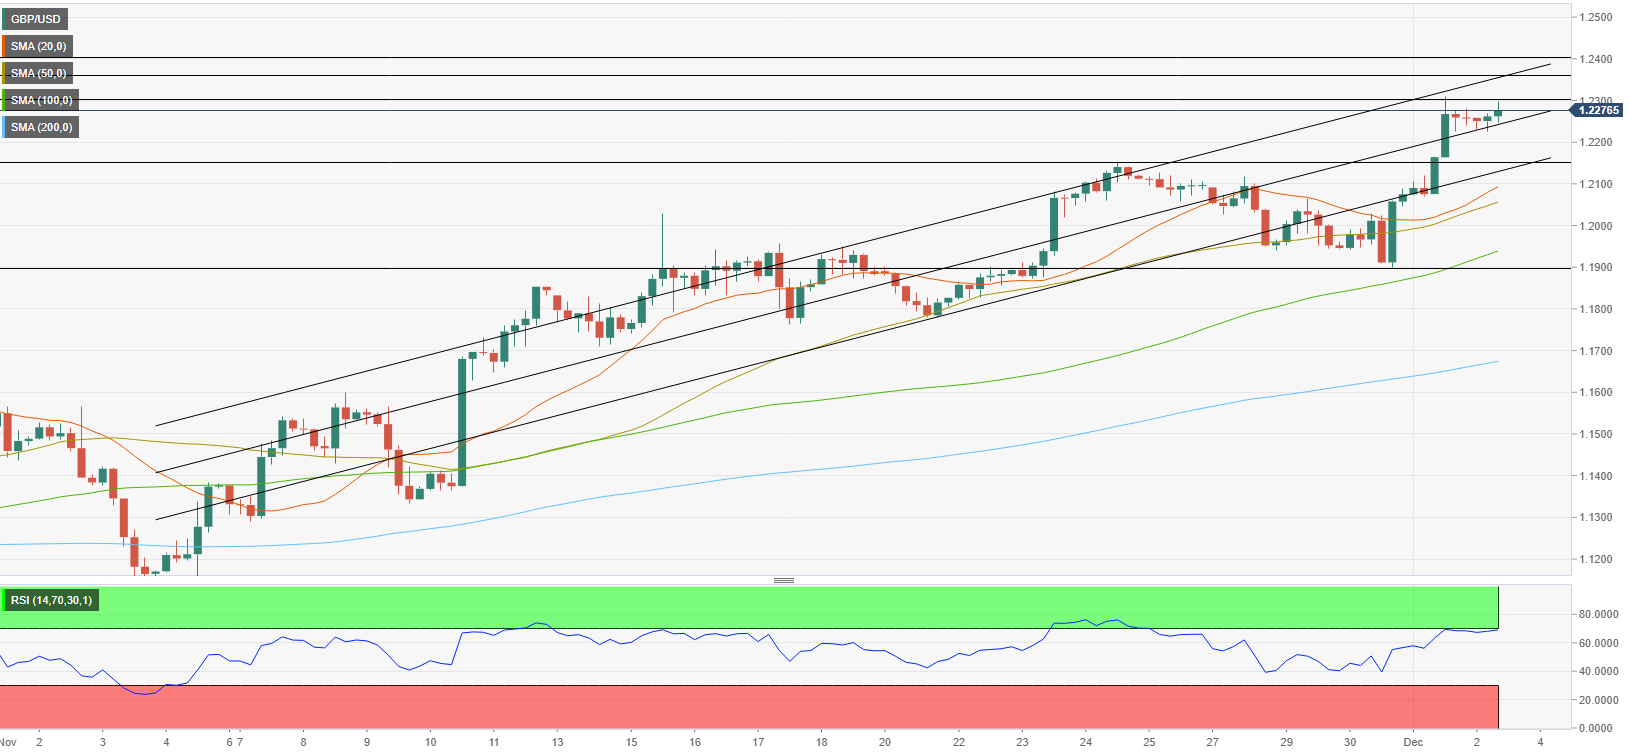
GBP/USD closed above the 200-day Simple Moving Average (SMA) for the first time since September 2021 on Thursday and this technical development is seen as a significant bullish tilt in the pair's near-term technical outlook.
On the four-hour chart, the Relative Strength Index (RSI) indicator stays near 70, suggesting that GBP/USD has turned technically overbought. Although the pair could stage a technical correction, bulls are likely to remain interested unless it returns below 1.2150 (200-day SMA). Furthermore, GBP/USD fluctuates in the upper half of the ascending trend line coming from early November.
On the upside, 1.2300 (psychological level, static level) aligns as interim resistance ahead of 1.2360 (static level from June) and 1.2400 (psychological level, upper limit of the ascending regression channel).
First support is located at 1.2230 (mid-point of the ascending regression channel)before 1.2200 (psychological level) and 1.2150.
Premium
You have reached your limit of 3 free articles for this month.
Start your subscription and get access to all our original articles.
Author

Eren Sengezer
FXStreet
As an economist at heart, Eren Sengezer specializes in the assessment of the short-term and long-term impacts of macroeconomic data, central bank policies and political developments on financial assets.


