GBP/USD Forecast: Next bearish target aligns at 1.3530
- GBP/USD has struggled to gather recovery momentum after UK inflation data.
- The pair could extend its slide toward 1.3530 in the near term.
- 10-year US Treasury bond yield continues to push higher toward 2%.

The British pound has failed to capitalize on the hot UK inflation data out on Wednesday and GBP/USD is consolidating Tuesday's losses near 1.3600. The unabated flight to safety and the broad-based dollar strength suggest that the pair is unlikely to stage a convincing rebound in the near term.
The UK's Office for National Statistics announced earlier in the day that the Consumer Price Index (CPI) climbed to 5.4% on a yearly basis in December from 5.1% in November. This print surpassed the market forecast of 5.2% but the Producer Price Index - Input (PPI) declined to 13.5% from 15.2% in the same period, not allowing GBP/USD to gain traction.
The benchmark 10-year US Treasury bond yield is already up more than 5% so far this week and continues to edge closer to the critical 2% mark. The market speculation of a possible 50 basis points rate hike in March is fueling the rally in yeilds that is boosting the greenback.
Anna Wong, Chief US Economist for Bloomberg Economics said on Wednesday that their in-house model of the Fed reaction function shows that a 50 bps March rate increase was warranted.
US stock index futures have recovered from daily lows and the UK's FTSE 100 Index trades flat in the early European session, pointing to a modest improvement in risk sentiment and limiting GBP/USD's downside for the time being.
GBP/USD Technical Analysis
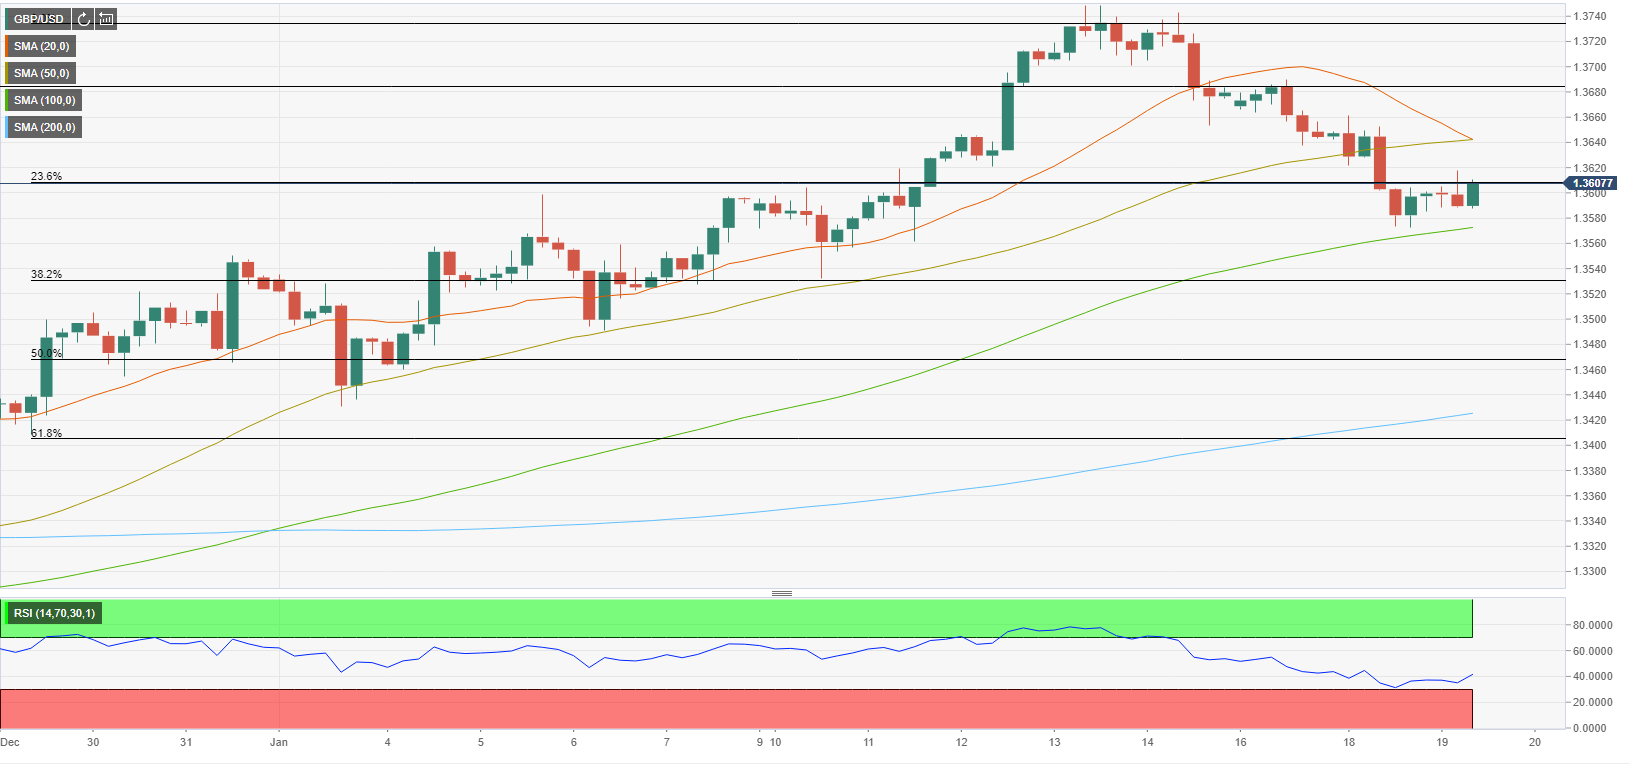
GBP/USD needs to hold above 1.3600 (Fibonacci 23.6% retracement level of the one-month uptrend) and confirm it as support in order to shake off the bearish pressure.
Ideally, the Relative Strength Index (RSI) on the four-hour chart, which is currently floating around 40, would need to recover to 50 and hold there for buyers to show interest. 1.3640 (20-period SMA, 50-period SMA) aligns as the next hurdle.
On the downside, additional losses toward 1.3530 (Fibonacci 38.2% retracement) could be witnessed if a four-hour candle closes below 1.3570, where the 100-period SMA is located.
Premium
You have reached your limit of 3 free articles for this month.
Start your subscription and get access to all our original articles.
Author

Eren Sengezer
FXStreet
As an economist at heart, Eren Sengezer specializes in the assessment of the short-term and long-term impacts of macroeconomic data, central bank policies and political developments on financial assets.


