- GBP/USD has extended its rebound after UK inflation data.
- The technical outlook suggests there is more room on the upside before GBP/USD turns overbought.
- The next bullish target is located at 1.3570.
GBP/USD has preserved its bullish momentum following Wednesday's advance and trades at fresh eight-day highs above 1.3500 early Thursday.
The stronger-than-expected Consumer Price Index (CPI) data from the UK reminded investors of the strong probability of the Bank of England (BoE) hiking the policy rate by 20 basis points in December and provided a boost to the British pound. Additionally, the modest selling pressure surrounding the greenback on falling US Treasury bond yields helped bulls to continue to dominate GBP/USD's action.
In the meantime, things remain relatively quiet on the Brexit front, allowing GBP/USD to continue to retrace the BoE-inspired drop.
The US Department of Labor's weekly Initial Jobless Claims will be the only data featured in the US economic docket. Furthermore, market participants will keep a close eye on US Treasury bond yields following Wednesday's sharp decline. Unless the benchmark 10-year US T-bond yield reclaims 1.6%, the greenback could find it difficult to outperform its rivals. Additionally, S&P Futures are up 0.2% in the early European session and the dollar could face additional selling pressure in case risk flows start to dominate the markets in the second half of the day.
GBP/USD Technical Analysis
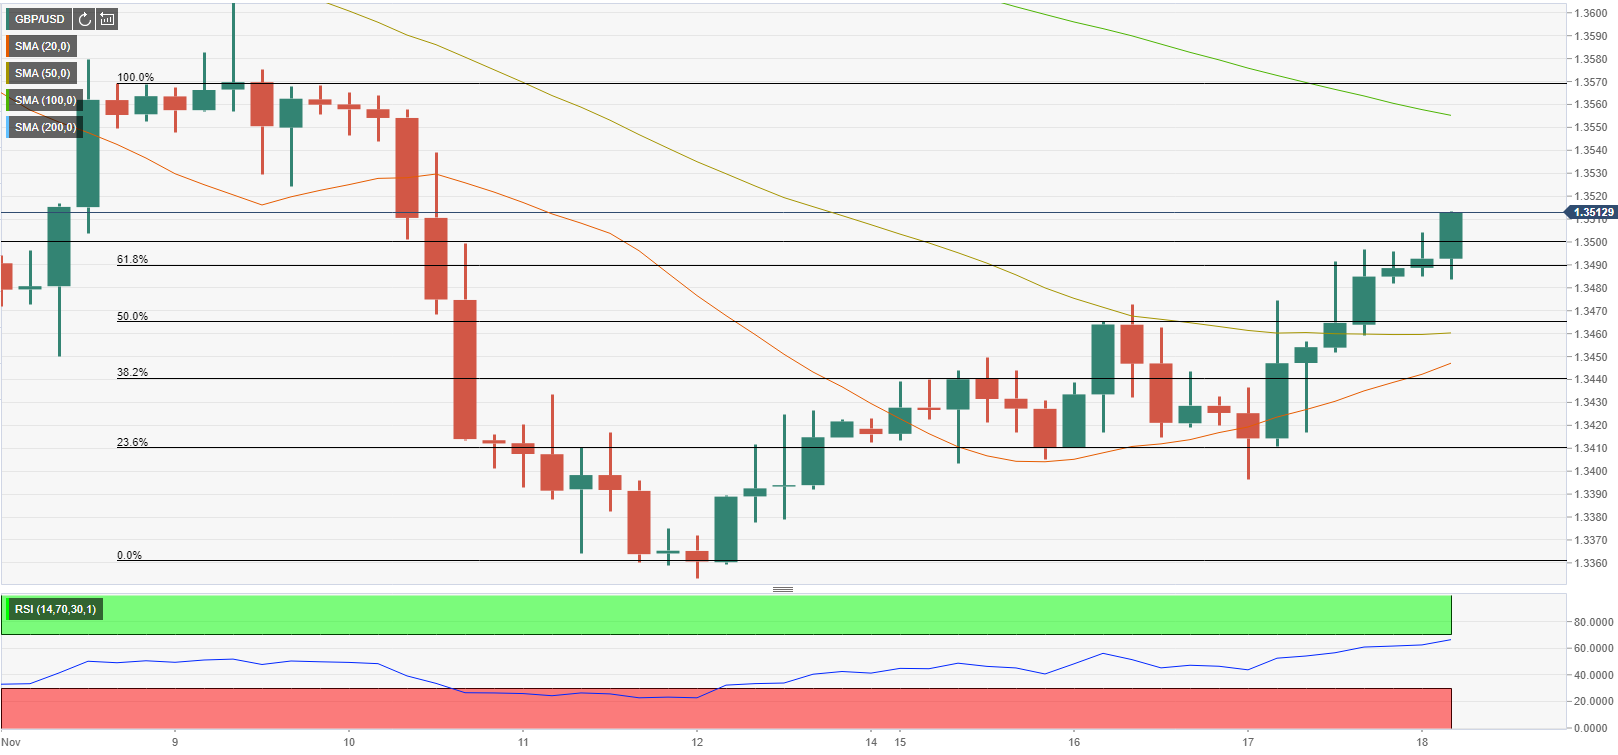
Although the last six candles on the four-hour chart closed in positive territory, the Relative Strength Index (RSI) indicator stays below 70, suggesting that there is more room on the upside before GBP/USD becomes technically overbought.
As of writing, the pair is trading above 1.3500 - the Fibonacci 61.8% retracement of the downtrend witnessed following the BoE's decision to leave its policy rate unchanged earlier in the month. In case buyers manage to continue to defend this level, GBP/USD could continue to push higher toward 1.3550 (100-period SMA) and 1.3570 (static level).
On the downside, 1.3470 (Fibonacci 50% retracement, 50-period SMA) aligns as the first support before 1.3440 (Fibonacci 38.2% retracement) if 1.3500 fails.
Information on these pages contains forward-looking statements that involve risks and uncertainties. Markets and instruments profiled on this page are for informational purposes only and should not in any way come across as a recommendation to buy or sell in these assets. You should do your own thorough research before making any investment decisions. FXStreet does not in any way guarantee that this information is free from mistakes, errors, or material misstatements. It also does not guarantee that this information is of a timely nature. Investing in Open Markets involves a great deal of risk, including the loss of all or a portion of your investment, as well as emotional distress. All risks, losses and costs associated with investing, including total loss of principal, are your responsibility. The views and opinions expressed in this article are those of the authors and do not necessarily reflect the official policy or position of FXStreet nor its advertisers. The author will not be held responsible for information that is found at the end of links posted on this page.
If not otherwise explicitly mentioned in the body of the article, at the time of writing, the author has no position in any stock mentioned in this article and no business relationship with any company mentioned. The author has not received compensation for writing this article, other than from FXStreet.
FXStreet and the author do not provide personalized recommendations. The author makes no representations as to the accuracy, completeness, or suitability of this information. FXStreet and the author will not be liable for any errors, omissions or any losses, injuries or damages arising from this information and its display or use. Errors and omissions excepted.
The author and FXStreet are not registered investment advisors and nothing in this article is intended to be investment advice.
Recommended Content
Editors’ Picks
EUR/USD recovers toward 1.0500 amid US Dollar pullback

EUR/USD is off the YTD lows of 1.0460, recovering toward 1.0500 in the European session on Tuesday. A positive shift in risk sentiment is fuelling a modest US Dollar pullback, supporting the pair. US JOLTS Job Openings data is next in focus amid a light EU economic calendar.
GBP/USD consolidates below 1.2100 ahead of US jobs data

GBP/USD is trading below 1.2100, consolidating near a multi-month trough touched this Tuesday. The pair is finding a floor amid a pause in the US Dollar upsurge and an upbeat market mood. Traders await the US JOLTS Job Openings data for fresh trading impetus.
Gold price struggles to capitalize on modest intraday recovery from multi-month low

Gold price (XAU/USD) has been trending lower over the past two weeks or so in the wake of the Fed signal that sticky inflation was likely to attract at least one more rate hike in 2023.
Chainlink price still trapped in range despite exhausted macro downtrend

Chainlink price eyes the upper boundary of a range at $8.148. It comes after the macro downtrend concluded, and could be the path to a new confirmed macro uptrend for LINK.
US JOLTS Preview: Job openings expected to remain broadly unchanged in August

JOLTS report will be watched closely by Federal Reserve officials ahead of September jobs data. Job openings are forecast to hold steady at around 8.8 million on the last business day of August.