GBP/USD Forecast: Bullish bias stays intact ahead of key US data
- GBP/USD has retreated below 1.1600 following a two-day rally.
- Investors await third-quarter GDP data from the US.
- UK PM Sunak reportedly reconsiders tax rises in the new fiscal plan.

GBP/USD has lost its bullish momentum and retreated below 1.1600 during the European trading hours on Thursday after having gained more than 300 pips in the last two days. The near-term technical outlook suggests that buyers look to retain control but the third-quarter Gross Domestic Product (GDP) data from the US is likely to drive the pair's action in the second half of the day.
The dollar continued to weaken against its rivals mid-week pressured by slumping US Treasury bond yields and the US Dollar Index (DXY) fell to a multi-week low near 109.50. Following the Bank of Canada's dovish 50 basis points rate hike on Wednesday, the probability of a 50 bps Fed rate hike in December climbed to 60% from 50% earlier in the day, according to the CME Group's FedWatch Tool.
The US Bureau of Economic Analysis is expected to report an annualized expansion of 2.4% in the third quarter. Although Fed policymakers made it clear that they will remain focused on taming inflation until they see a steady rise in the unemployment rate, a weak GDP reading could weigh on the greenback. On the other hand, a better-than-forecast growth figure could help the DXY erase a portion of its weekly losses and cause GBP/USD to extend its downward correction. September Durable Goods Orders and the weekly Initial Jobless Claims data will also be featured in the US economic docket.
Meanwhile, The Telegraph reported late Wednesday that British Prime Minister Rishi Sunak was considering major cuts in public spending and tax rises in the new budget. At this point, it's difficult to say how such a significant U-turn in the fiscal plan could impact the British pound since the Bank of England is scheduled to announce its policy decisions before having a chance to see Sunak's budget.
GBP/USD Technical Analysis
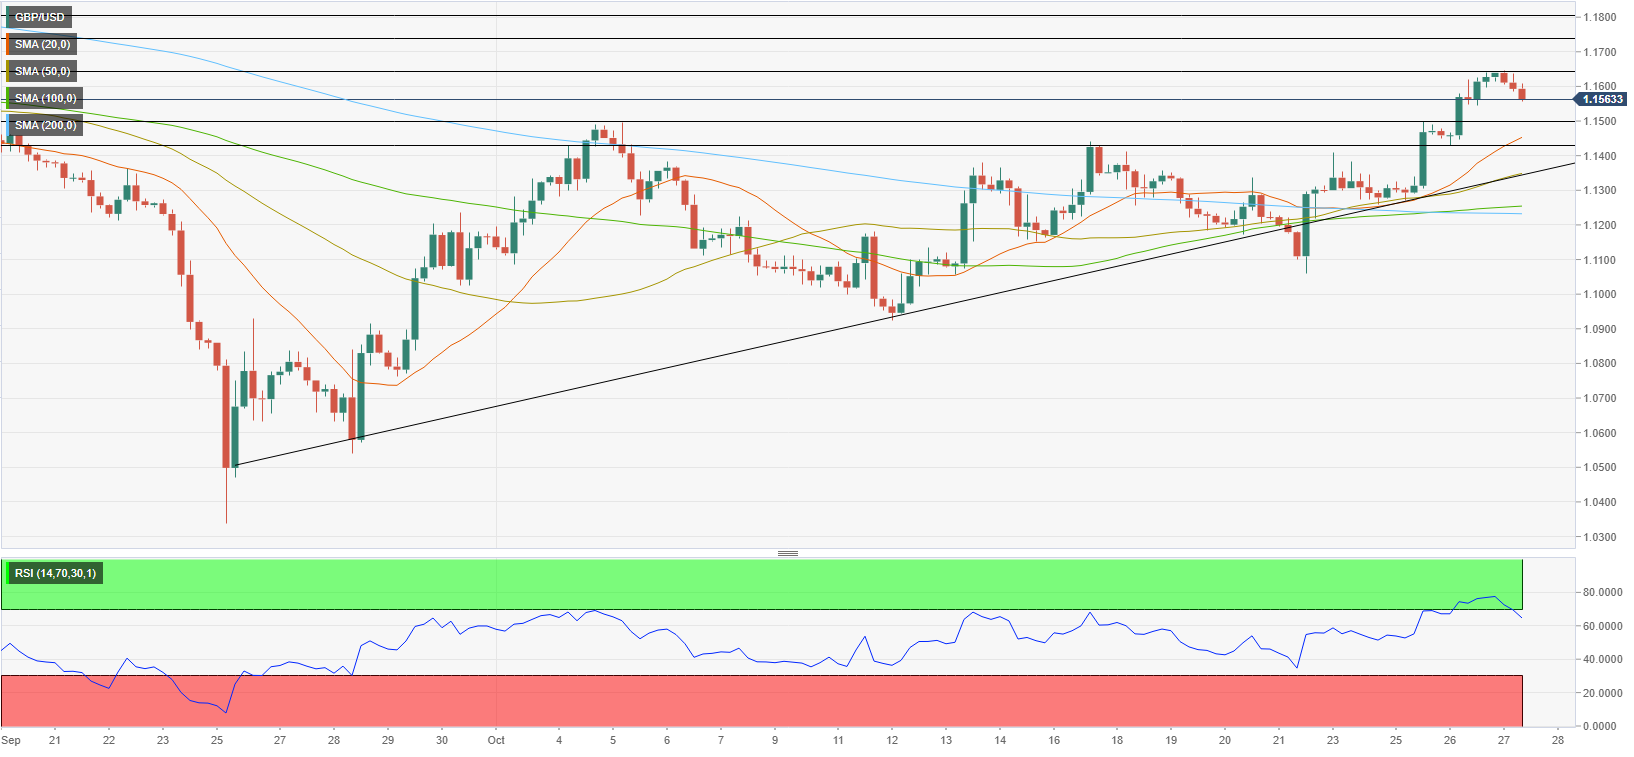
The Relative Strength Index (RSI) indicator on the four-hour chart declined below 70, suggesting that GBP/USD's latest decline was a technical correction. The pair stays comfortably above key moving averages and it continues to trade above the ascending trend line coming from late September, confirming the bullish bias.
On the downside, 1.1500 (psychological level, former resistance) aligns as initial support. A four-hour close below that level could be seen as a bearish development and open the door for another leg lower toward 1.1445 (20-period SMA) and 1.1400 (psychological level, static level).
1.1650 (static level, multi-week high set on Thursday) forms initial resistance. If that level is confirmed as support, 1.1700 (psychological level) and 1.1750 (static level) could be seen as the next bullish targets.
Premium
You have reached your limit of 3 free articles for this month.
Start your subscription and get access to all our original articles.
Author

Eren Sengezer
FXStreet
As an economist at heart, Eren Sengezer specializes in the assessment of the short-term and long-term impacts of macroeconomic data, central bank policies and political developments on financial assets.


