GBP/USD Forecast: Brexit talks to reveal next short-term direction
- GBP/USD has been fluctuating in a relatively tight range.
- UK's Frost says EU proposals on Northern Ireland protocol are not good enough.
- Dollar holds its ground at the start of the week.

GBP/USD has been moving up and down in a narrow band below 1.3800 since the beginning of the week as investors refrain from making large bets while waiting for fresh Brexit developments.
The latest headlines suggest that the UK is not satisfied with the EU's proposals on the Northern Ireland protocol.
David Frost, the British minister responsible for implementing the Brexit deal, said on Monday that the changes offered by the EU don't deliver on the UK's desire of "freeing up" trade in Northern Ireland. "The problem with the EU proposals on Northern Ireland is that they don't go far enough," Frost added. More importantly, Frost rejected the idea of the UK compromising over the European Court of Justice's involvement in overseeing the Brexit deal.
Market participants are likely to ignore the potential positive impact of the Bank of England's (BoE) hawkish policy outlook on the British pound as long as Brexit issues remain unresolved.
In the meantime, the dollar is staying resilient against its major rivals, not allowing GBP/USD to regain its traction. Ahead of September New Home Sales and the Conference Board Consumer Confidence Index data from the US, the US Dollar Index, which tracks the greenback's performance against a basket of six major currencies, is consolidating Monday's gains below 94.00.
Conference Board Consumer Confidence October Preview: Watch what we do...
In case the index manages to climb above that level, technical buying pressure on the dollar could gather strength and weigh on GBP/USD. Nevertheless, the pair's upside potential in the near term remains limited, unless it's driven by positive Brexit headlines, even if the USD loses its footing.
GBP/USD technical analysis
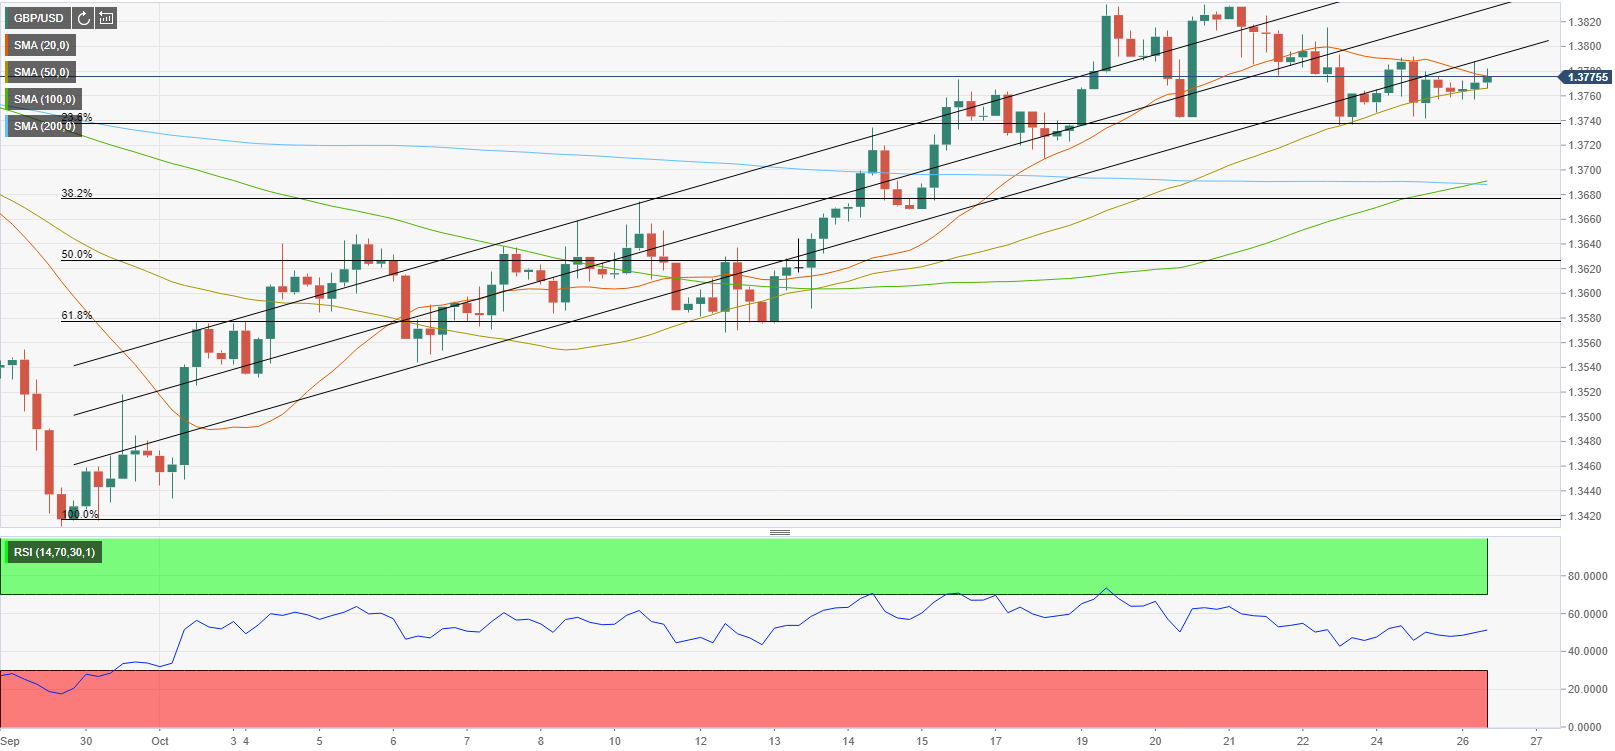
GBP/USD is having a difficult time returning to the ascending regression channel coming from late September. On a slightly bullish note, the Relative Strength Index (RSI) indicator on the four-hour chart is holding near 50, suggesting that sellers are yet to dominate the pair's action.
On the downside, the first technical support aligns at 1.3740 (Fibonacci 23.6% retracement of the latest uptrend) ahead of 1.3700 (psychological level, 200-period SMA, 100-period SMA) and 1.3680 (Fibonacci 38.2% retracement).
A daily close above 1.3800 (psychological level, ascending channel resistance) could be seen as a bullish development. Next resistances could be seen at 1.3830/40 (October 20 high, October 21 high, middle line of the channel) and 1.3880 (static level).
Premium
You have reached your limit of 3 free articles for this month.
Start your subscription and get access to all our original articles.
Author

Eren Sengezer
FXStreet
As an economist at heart, Eren Sengezer specializes in the assessment of the short-term and long-term impacts of macroeconomic data, central bank policies and political developments on financial assets.


