GBP/USD Forecast: Pound Sterling could correct lower before targeting new monthly high
- GBP/USD edges higher toward 1.2600 early Monday.
- The technical picture shows overbought conditions for the pair.
- UK jobs report and US inflation data on Tuesday could trigger the next big movement.

GBP/USD took advantage of the broad US Dollar (USD) weakness on Monday and climbed to its highest level in a month, above 1.2590. The pair faces its next resistance at 1.2600, but the near-term technical outlook suggests that there could be a downward correction before the next leg higher.
The upbeat market mood at the beginning of the week doesn't allow the safe-haven USD to stay resilient against its main competitors, helping GBP/USD to stay afloat in positive territory. The UK's FTSE 100 Index rises 0.3% and US stock index futures gain between 0.1% and 0.3% in the European session.
Earlier in the day, Bank of England (BoE) policymaker Jonathan Haskel's hawkish comments also helped Pound Sterling gather strength. "My own view is that it's important we continue to lean against the risks of inflation momentum, and therefore that further increases in interest rates cannot be ruled out," Haskel wrote in an article published in Scottish newspaper The Scotsman.
On Tuesday, UK's Office for National Statistics will release the labor market data. Annual wage inflation, as measured by Average Earnings Excluding Bonus, is forecast to rise to 6.9% in the three months to April from 6.7% in the quarter to March. Markets are fully pricing in another 25 basis points (bps) Bank of England rate hike at the next policy meeting on June 22. Hence, soft wage inflation could make it difficult for Pound Sterling to continue to outperform its rivals, while the positive impact of a stronger-than-forecast reading on the currency could remain short-lived.
on Tuesday, May inflation data from the US and Bank of England Governor Andrew Bailey's speech before the Lords Economic Affairs Committee hearing could also cause the pair to fluctuate wildly.
GBP/USD Technical Analysis
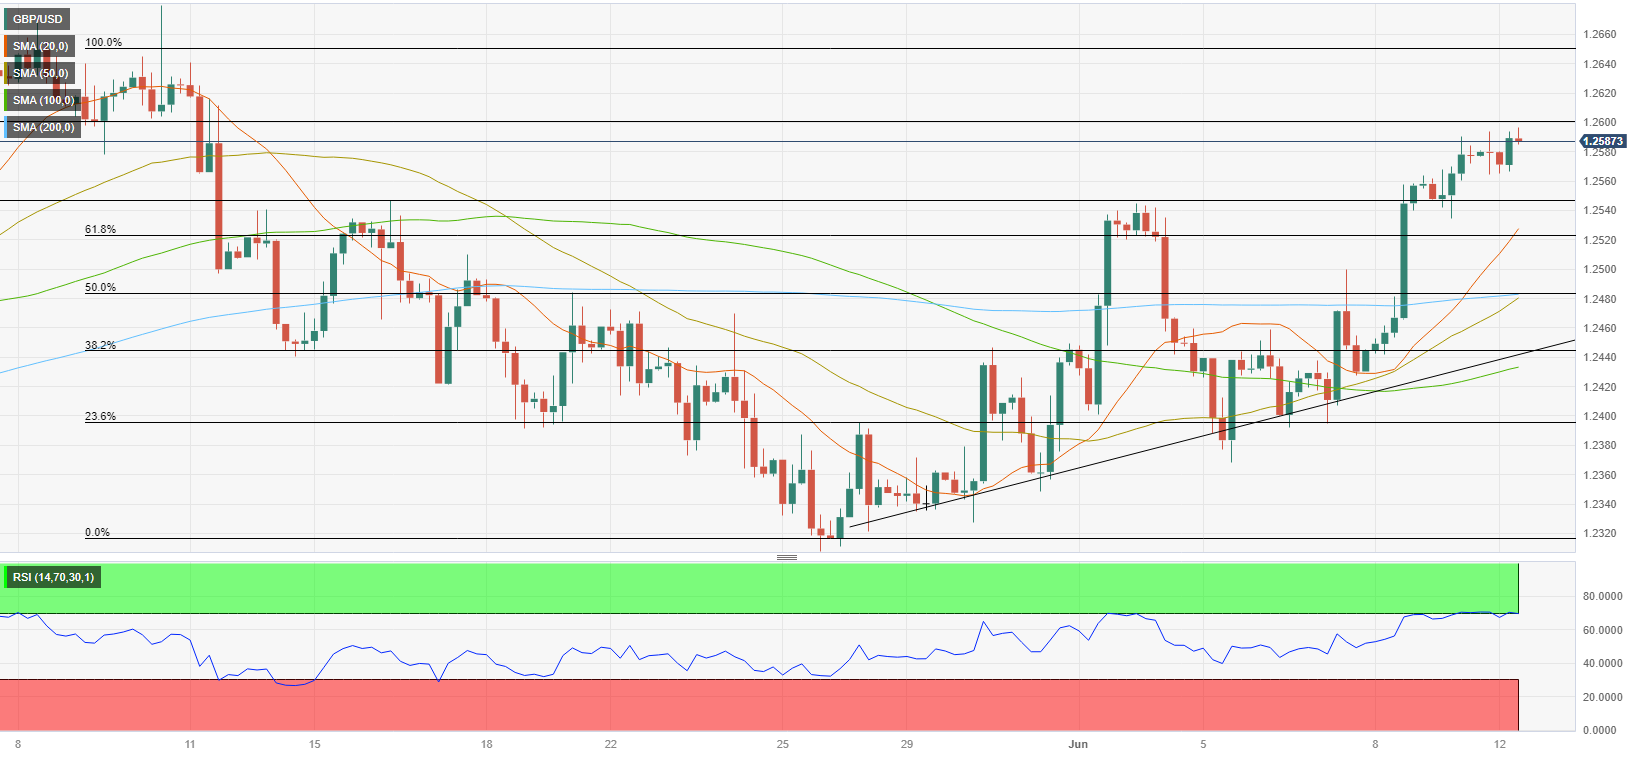
1.2600 (psychological level, static level) aligns as immediate resistance for GBP/USD. The Relative Strength Index (RSI) indicator on the four-hour chart, however, stays in overbought territory slightly above 70, suggesting that the pair could correct lower before attempting to clear that hurdle.
On the downside, 1.2550 (static level) could be seen as first technical support before 1.2520 (Fibonacci 61.8% retracement) of the latest downtrend). A daily close below the latter could attract bears and cause GBP/USD to stretch lower to 1.2480 (200-period Simple Moving Average).
In case GBP/USD rises above 1.2600 and confirms that level as support, next bullish target could be set at 1.2650 (static level, beginning point of the downtrend).
Premium
You have reached your limit of 3 free articles for this month.
Start your subscription and get access to all our original articles.
Author

Eren Sengezer
FXStreet
As an economist at heart, Eren Sengezer specializes in the assessment of the short-term and long-term impacts of macroeconomic data, central bank policies and political developments on financial assets.


