GBP/USD Forecast: 1.2050 aligns as next bearish target amid risk aversion
- GBP/USD has failed to build on Thursday's modest recovery gains.
- Dollar holds its ground with safe-haven flows continuing to dominate the markets.
- Focus shifts to ISM Manufacturing PMI data from the US.

GBP/USD has lost its traction and declined toward 1.2100 after having registered modest gains on Thursday. The pair remains technically bearish in the short term and it is likely to extend its slide unless there is a convincing improvement in risk mood.
Month-end flows in the second half of the day on Thursday and softer-than-expected inflation data from the US ramped up market volatility and caused the greenback to lose interest. The US Dollar Index closed the day in negative territory but didn't have a difficult time reversing its direction early Friday. US stock index futures are down between 0.6% and 0.7%, suggesting that investors continue to stay away from risk-sensitive assets ahead of the weekend.
Meanwhile, European Commission Vice President Maroš Šefčovič said that the negative impact of Brexit on the UK economy was "starting to show more clearly." Šefčovič further explained that UK imports of services and goods to the EU were down significantly when compared to 2019 levels.
In the second half of the day, the ISM Manufacturing PMI data from the US will be looked upon for fresh impetus. The headline PMI is expected to edge lower to 55 from 56.1 in May. The Prices Paid component is also forecast to decline to 80.5 from 82.2. In case the report shows that the manufacturing sector is losing growth momentum with price pressures easing, this could be seen as a dollar-negative development and help the pair rebound. On the other hand, an upbeat PMI reading should help the dollar continue to outperform its rivals as it would do little to nothing to change the market pricing of a 75 basis points rate hike in July.
GBP/USD Technical Analysis
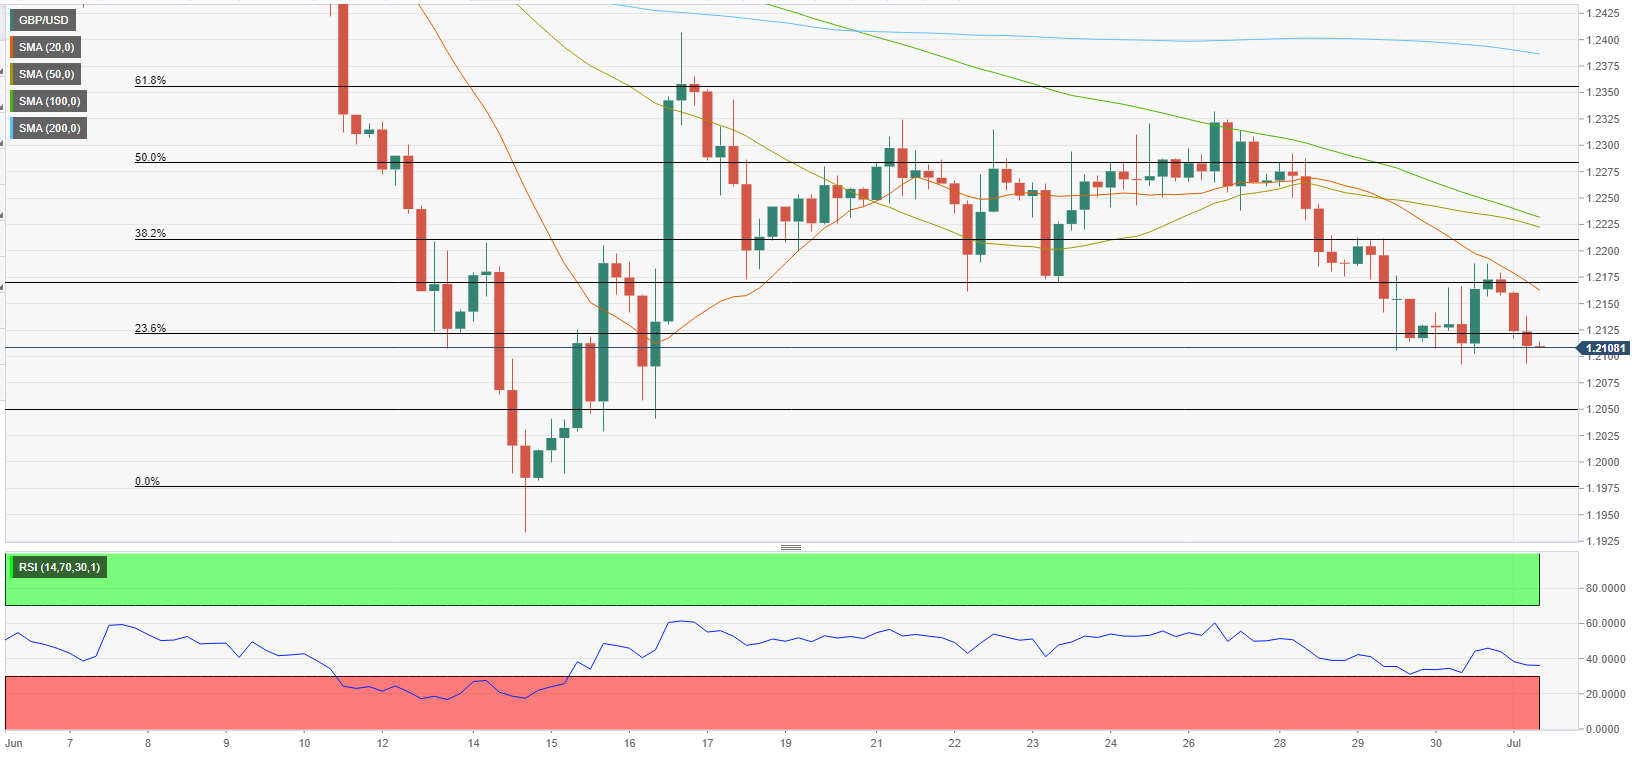
Despite the rebound witnessed in the late American session on Thursday, the Relative Strength Index (RSI) indicator stayed below 50 and started to push lower early Friday, suggesting that the pair has completed its correction before the next leg lower.
On the downside, 1.2100 (static level, psychological level) aligns as immediate support. With a four-hour close below that level, additional losses toward 1.2050 (static level) and 1.2000 (psychological level) could be witnessed.
First resistance is located at 1.2120 (Fibonacci 23.6% retracement of the latest downtrend) ahead of 1.2170 (static level, 20-period SMA) and 1.2200 (Fibonacci 38.2% retracement).
Premium
You have reached your limit of 3 free articles for this month.
Start your subscription and get access to all our original articles.
Author

Eren Sengezer
FXStreet
As an economist at heart, Eren Sengezer specializes in the assessment of the short-term and long-term impacts of macroeconomic data, central bank policies and political developments on financial assets.


