GBP/USD finds a floor at 1.3200 after Fed-induced sell-off

The GBP/USD pair is consolidating around the 1.3200 level on Thursday, following significant losses in the previous session. The pair is now trading near its lowest point since April 2025, with selling pressure intensifying after the Federal Reserve cut interest rates by 25 basis points. While delivering the expected cut, Fed Chair Jerome Powell struck a hawkish note by stressing that further easing this year is not guaranteed, bolstering the US dollar.
The pound faces its own set of domestic headwinds. Mounting expectations of a Bank of England rate cut, combined with concerns over the upcoming November budget, are weighing on sentiment. During parliamentary hearings, Prime Minister Keir Starmer refused to rule out potential rises in income tax, national insurance, and VAT.
Further compounding the issue, press reports suggest the Office for Budget Responsibility (OBR) plans to lower its productivity growth forecast by approximately 0.3 percentage points. Such a revision could create a budget deficit of around £20 billion.
Softer-than-expected inflation data and a reported decline in food prices by the BRC have reinforced the market's view that the Bank of England is moving closer to easing monetary policy.
Technical analysis: GBP/USD
Four-hour chart
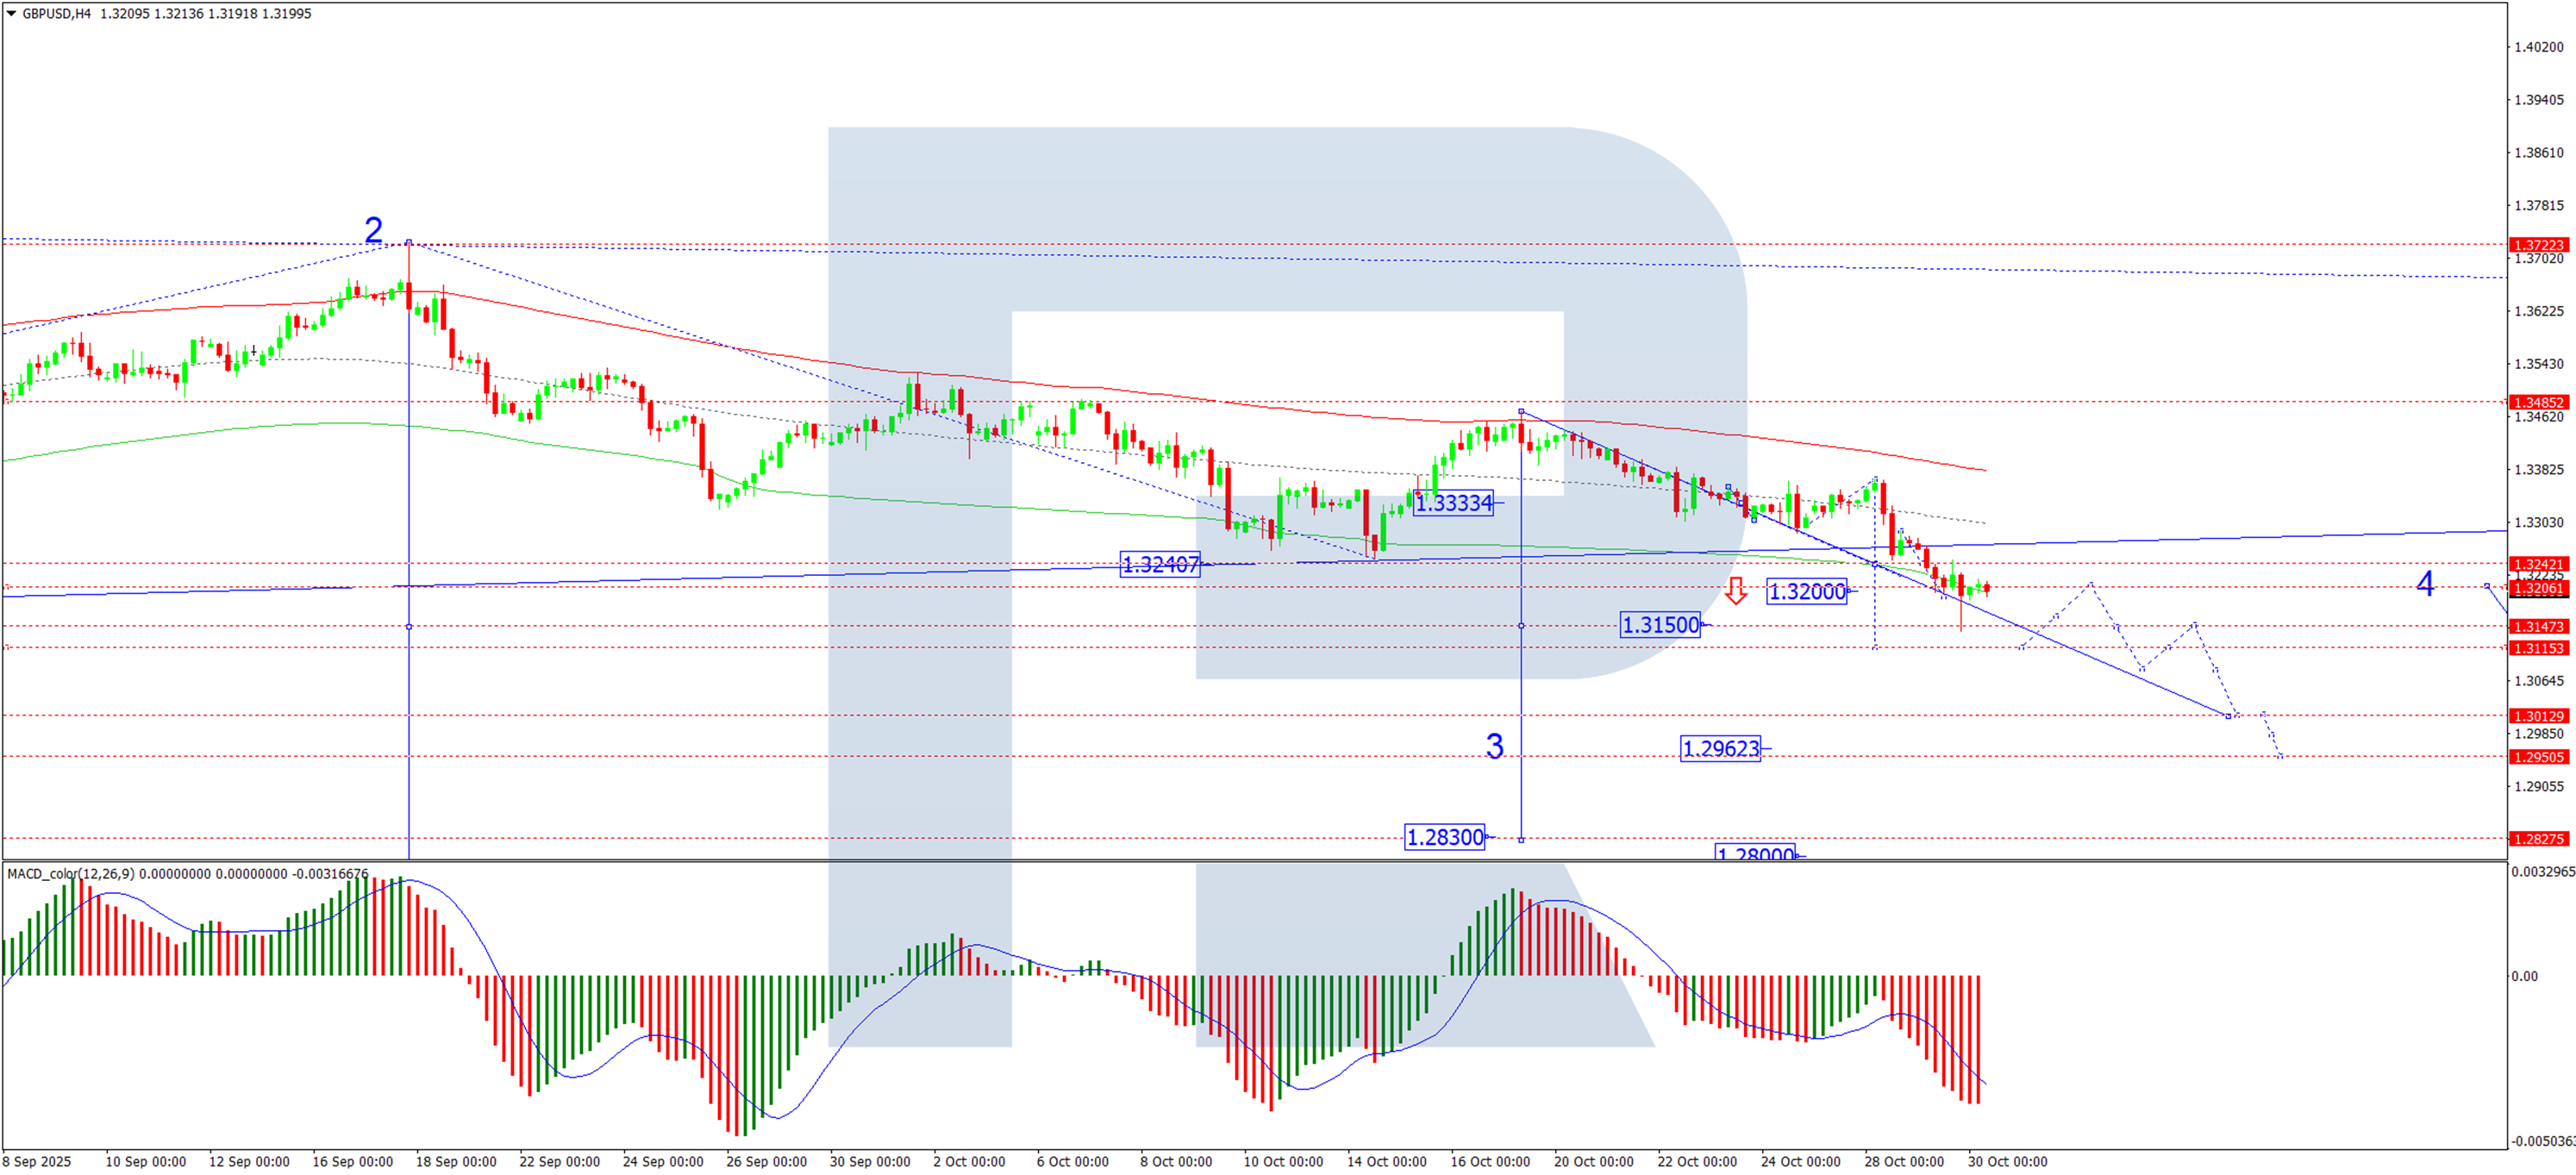
On the H4 chart, GBP/USD is developing a bearish wave structure targeting 1.3111. We anticipate the pair reaching this level before forming a consolidation range around it. Critically, this move is considered the third and typically powerful wave within the broader downtrend, with the 1.3111 target representing only its initial phase. Following consolidation, we expect a downward breakout and a continuation of the sell-off to at least 1.2830. This bearish scenario is confirmed by the MACD indicator, whose signal line is below zero and pointing decisively downward, indicating sustained selling momentum.
One-hour chart
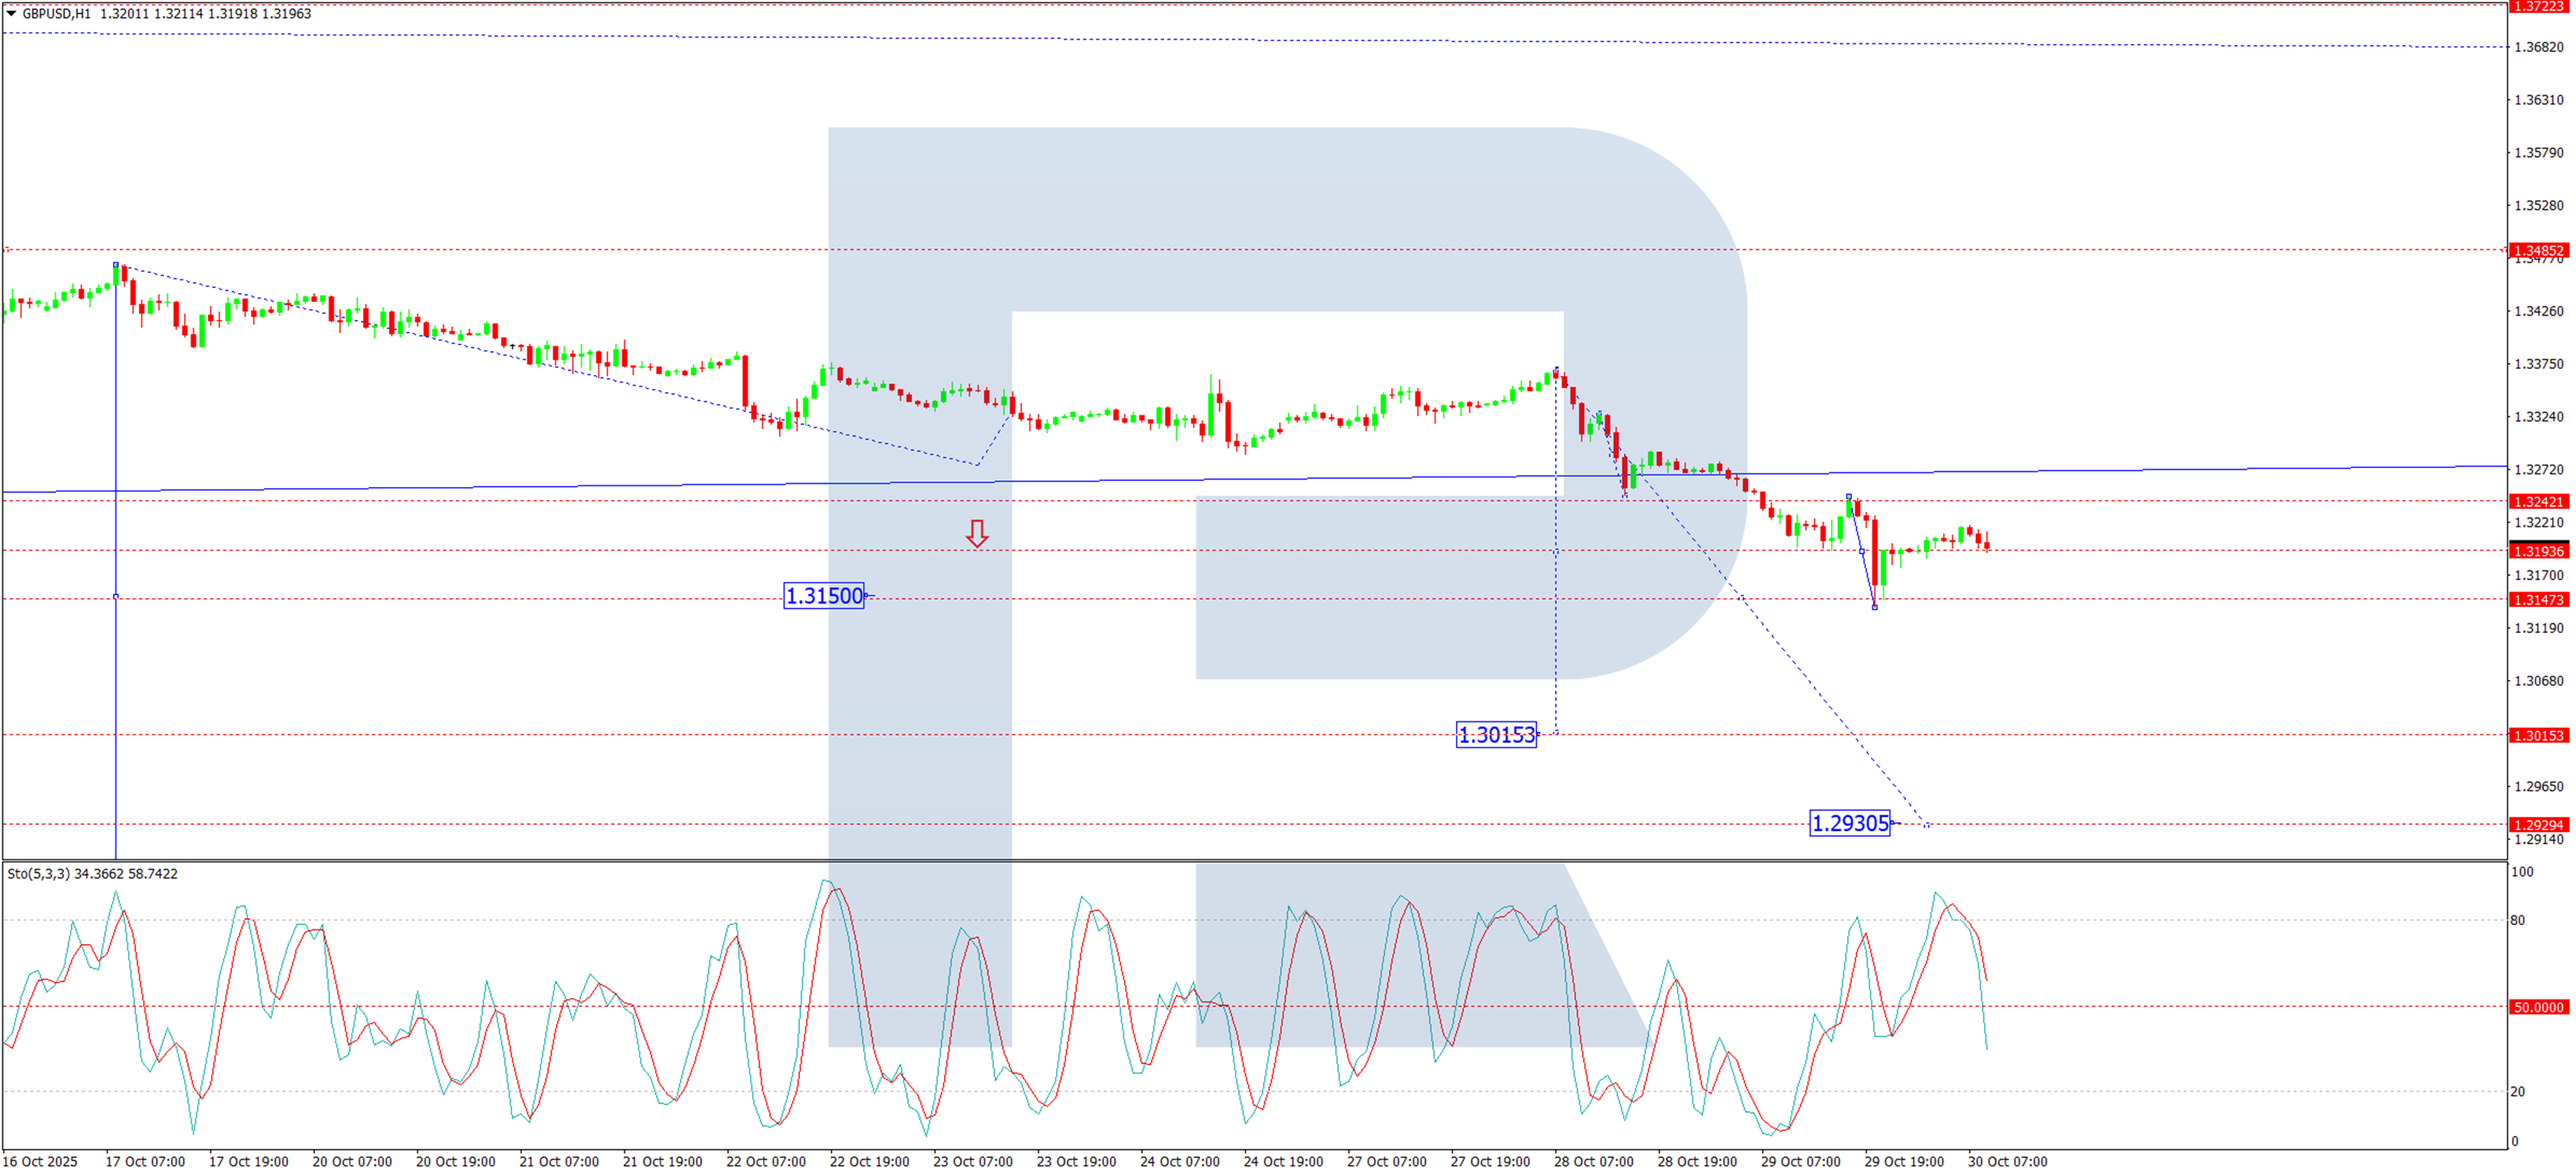
On the H1 chart, the pair has completed a downward impulse to 1.3193 and formed a consolidation range, which has since expanded down to 1.3139. We now foresee a technical retest of 1.3217 from below, after which a further decline towards 1.3111 is expected. A decisive break below this support level would open the path for a move down to at least 1.3015. The Stochastic oscillator supports this outlook, with its signal line having turned down from below the 80 level and heading towards 20, reflecting building bearish momentum in the short term.
Conclusion
GBP/USD is stabilising after a sharp drop, but the fundamental and technical backdrop remains bearish. Hawkish Fed rhetoric and a dovish shift in BoE expectations, alongside worrying UK fiscal signals, suggest any recovery may be short-lived. The path of least resistance appears lower, with key technical targets at 1.3111 and 1.3015.
Author

RoboForex Analysis Department
RoboForex
RoboForex Analysis Department provides timely market insights, expert technical analysis, and actionable forecasts across forex, commodities, indices, and equities.