GBP/USD Elliott Wave technical analysis [Video]
![GBP/USD Elliott Wave technical analysis [Video]](https://editorial.fxsstatic.com/images/i/GBPUSD-neutral-object-1.png)
GBP/USD Elliott Wave technical overview
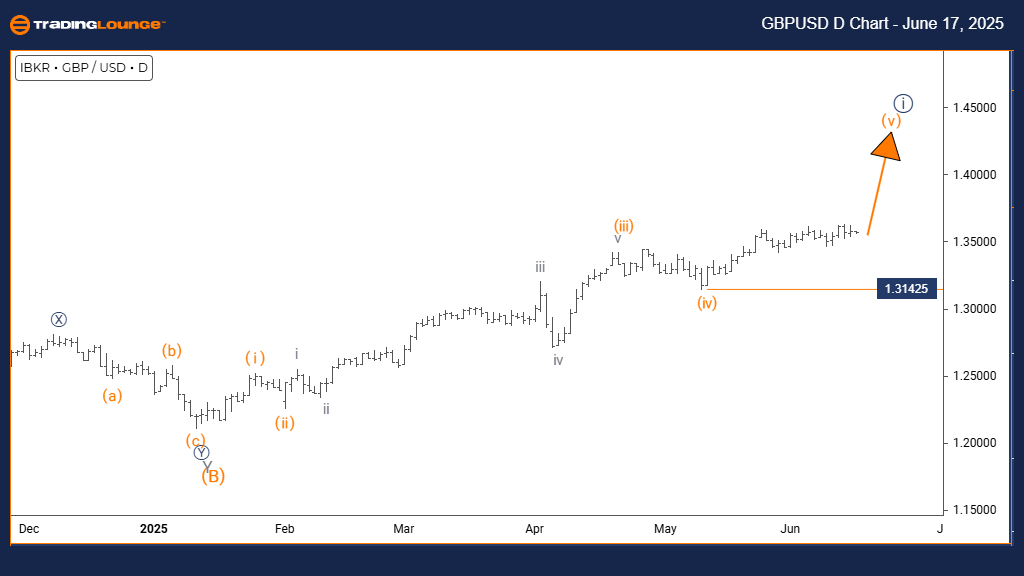
Function: Bullish Trend.
Mode: Impulsive.
Structure: Orange Wave 5.
Position: Navy Blue Wave 1.
Direction (Next higher degree): Navy Blue Wave 2.
Details: Orange wave 4 appears completed, and orange wave 5 is now active. The invalidation level for this wave count is 1.31425.
Analysis summary
The GBPUSD daily chart presents a bullish trend characterized by impulsive price movement, indicating continued strength. Currently, the market is unfolding orange wave 5 within the broader navy blue wave 1 cycle. This positioning signals that GBPUSD is in the final stage of an impulsive advance, typically suggesting strong upward momentum.
The end of orange wave 4 signals the beginning of wave 5, generally associated with the final leg of an impulse sequence. The next key wave to observe will be navy blue wave 2, expected to be a corrective move following the completion of wave 5.
It is important to monitor the invalidation level at 1.31425. A drop below this level would negate the current wave scenario, prompting a reassessment of the bullish outlook. Until that occurs, the structure supports a continuation of the upward move.
Conclusion
GBPUSD is poised for potential further gains as wave 5 progresses. While buying interest appears strong, traders should be cautious and watch for reversal signals since this represents the final wave of the navy blue wave 1 structure.
GBP/USD Elliott Wave technical overview
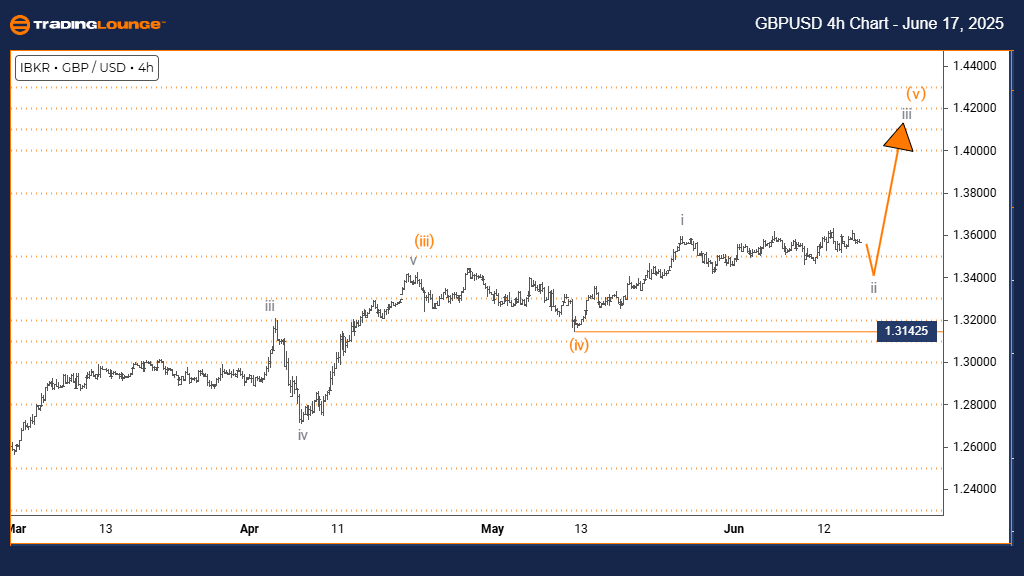
Function: Counter Trend.
Mode: Corrective.
Structure: Gray Wave 2.
Position: Orange Wave 3.
Direction (Next higher degree): Gray Wave 3.
Details: Gray wave 1 appears complete, and gray wave 2 is now unfolding. The invalidation level is set at 1.31425.
Analysis summary
The 4-hour chart of GBPUSD shows a corrective phase developing within a counter-trend setup. This movement is interpreted as gray wave 2 forming within the larger orange wave 3 cycle. The price action indicates a typical retracement, often seen before the trend resumes.
Gray wave 1 is considered complete, shifting the focus to the current correction under gray wave 2. This wave typically retraces a segment of wave 1's movement, allowing the market to consolidate. Once completed, gray wave 3 is expected to resume the dominant trend direction.
The structure suggests GBPUSD may trade within a range or experience minor pullbacks before the upward trend picks up again. The invalidation point at 1.31425 remains key; a move below this level would void the current Elliott Wave outlook.
Conclusion
GBPUSD is currently navigating a corrective wave (gray wave 2), implying temporary consolidation within a longer-term bullish sequence. Traders should closely observe the development of this wave for signs of completion, ahead of a potential move into gray wave 3.
GBP/USD Elliott Wave technical overview [Video]
Author

Peter Mathers
TradingLounge
Peter Mathers started actively trading in 1982. He began his career at Hoei and Shoin, a Japanese futures trading company.


