GBP/USD Elliott Wave technical analysis [Video]
![GBP/USD Elliott Wave technical analysis [Video]](https://editorial.fxsstatic.com/images/i/gbp-usd-001.jpg)
GBP/USD Elliott Wave technical analysis
Function: Bullish Trend.
Mode: Impulsive.
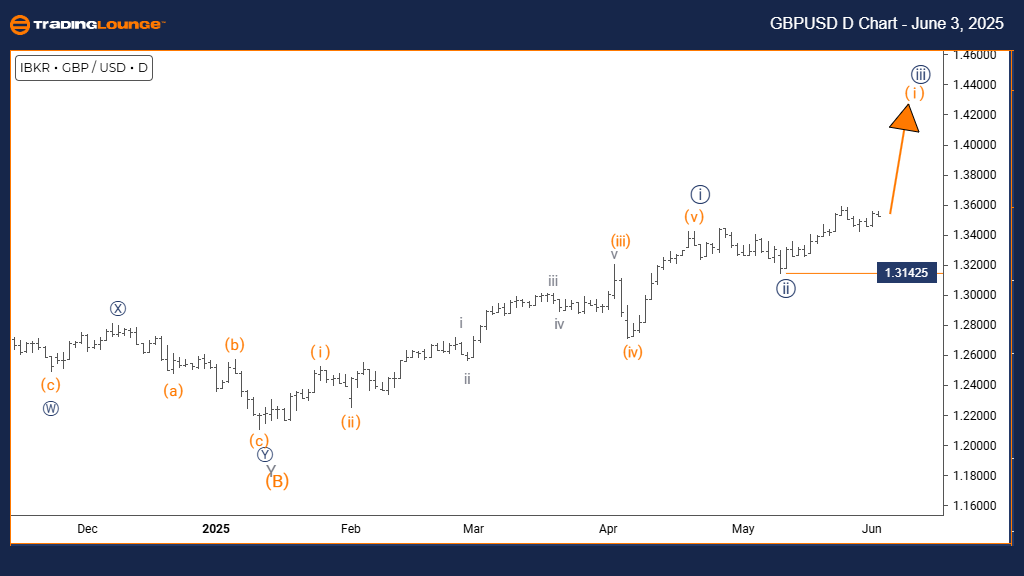
Structure: Orange wave 1.
Position Navy blue wave 3.
Direction next higher degrees: Orange wave 1 (initiated).
Details: Navy blue wave 2 appears complete; orange wave 1 of 3 now underway.
Cancel invalid level: 1.31425.
The daily chart presents a bullish outlook for GBPUSD, highlighting strong impulsive movement in the current wave pattern. The analysis indicates the formation of orange wave one as part of a larger bullish trend, situated within navy blue wave three. This implies the completion of navy blue wave two’s corrective phase and the start of a new impulse, marking the early phase of a potentially extensive upward trend.
It’s confirmed that navy blue wave two has likely ended, and orange wave one is gaining momentum. This impulsive development reveals increasing buying pressure. Based on the daily timeframe, this suggests substantial upside potential. A key technical level is set at 1.31425; breaching it would invalidate the current wave configuration and may signal either a more intricate correction or necessitate reevaluation.
This technical setup provides key insights into the GBPUSD's position within its broader bullish trajectory. It signals the beginning of what may be an extended advance, with orange wave one marking the first segment of navy blue wave three. The next likely move in higher degrees is the progression of orange wave one within this broader wave.
Traders should monitor ongoing price action for confirmation of the impulse wave’s continuation and keep an eye on the invalidation level for potential weakness. The current wave structure supports a bullish bias, but any significant break of the support level could prompt a review of the outlook. The daily analysis highlights the strength and duration potential of this new bullish phase.
GBP/USD daily chart
GBP/USD four-hour chart
Function: Counter Trend.
Mode: Corrective.
Structure: Gray wave 2.
Position: Orange wave 1.
Direction next higher degrees: Gray wave 3.
Details: Gray wave 1 seems complete; gray wave 2 is currently active.
Cancel invalid level: 1.31425.
The 4-hour chart highlights GBPUSD in a corrective counter-trend within its larger bullish structure. The analysis identifies gray wave two forming as a retracement within orange wave one, suggesting that the pair has ended gray wave one's advance and is now consolidating. This typically signals a short-term pause before the bullish trend resumes.
It is confirmed that gray wave one has likely finished, leading into gray wave two’s corrective pullback. This phase is expected to have limited downside while preserving the broader upward trajectory. The key invalidation level is at 1.31425—breaking this level would call the wave structure into question and may suggest either a more intricate corrective pattern or trend shift.
This technical structure helps traders understand GBPUSD's placement within its market cycle. The current correction may introduce volatility, but it is seen as a temporary phase. Gray wave two is likely a pause before wave three resumes the upward momentum. Traders should observe price activity for signals that confirm the end of this retracement and the start of the next wave up.
The chart offers valuable insight into the counter-trend behavior while projecting a continuation of the bullish structure. Vigilant monitoring of chart patterns and risk management remains essential during this uncertain phase. This corrective move is viewed as part of a larger bullish wave, not the beginning of a bearish trend.

GBP/USD Elliott Wave technical analysis [Video]
Author

Peter Mathers
TradingLounge
Peter Mathers started actively trading in 1982. He began his career at Hoei and Shoin, a Japanese futures trading company.


