GBP/USD Elliott Wave technical analysis [Video]
![GBP/USD Elliott Wave technical analysis [Video]](https://editorial.fxsstatic.com/images/i/GBPUSD-bullish-object-1.png)
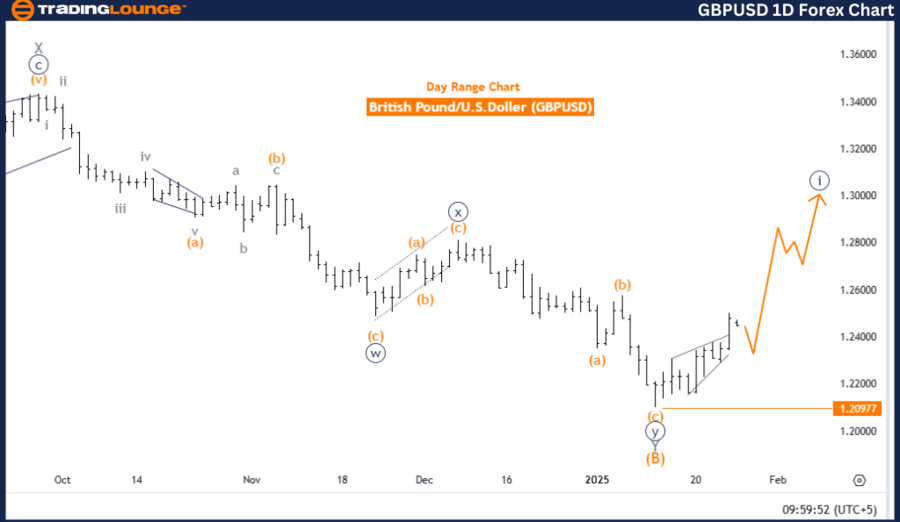
GBPUSD Elliott Wave Analysis Trading Lounge.
British Pound/ U.S. Dollar (GBPUSD) day chart.
GBP/USD Elliott Wave technical analysis
-
Function: Bullish Trend.
-
Mode: Impulsive.
-
Structure: Navy Blue Wave 1.
-
Position: Gray Wave 1.
-
Direction next lower degrees: Navy Blue Wave 2.
-
Details: Navy Blue Wave 1 of Gray Wave 1 appears to be completed; Navy Blue Wave 2 is currently active.
-
Wave cancel invalidation level: 1.20977.
The analysis focuses on the GBPUSD currency pair through Elliott Wave Theory on a daily chart, indicating a bullish trend with an impulsive wave pattern. The key observation lies in Navy Blue Wave 1, which is part of the broader Gray Wave 1, marking the onset of a fresh upward movement.
Currently, the market suggests the completion of Navy Blue Wave 1 within Gray Wave 1, transitioning into the corrective phase of Navy Blue Wave 2. This phase temporarily consolidates previous gains before the bullish trend resumes with further impulsive price action.
The set invalidation level for this analysis is 1.20977, serving as a crucial threshold. A drop below this point would invalidate the current wave structure and necessitate a reassessment of the market outlook.
Summary
The GBPUSD daily chart analysis underscores a bullish trend fueled by the conclusion of Navy Blue Wave 1 within Gray Wave 1. The ongoing Navy Blue Wave 2 introduces a corrective phase, offering potential trading opportunities in anticipation of the next upward move. The invalidation level acts as a vital reference for risk management and confirms the validity of the wave count. This structured approach offers traders valuable insights into the market's evolution and prepares them for the continuation of the bullish trend in accordance with Elliott Wave principles.
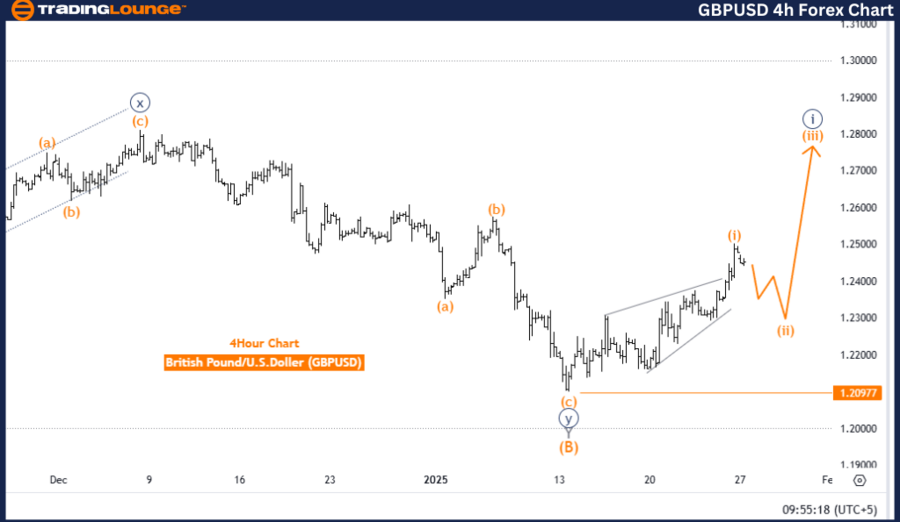
British Pound/ U.S. Dollar (GBPUSD) four-hour chart
GBP/USD Elliott Wave technical analysis
-
Function: Counter Trend.
-
Mode: Corrective.
-
Structure: Orange Wave 2.
-
Position: Navy Blue Wave 1.
-
Direction next higher degrees: Orange Wave 3.
-
Details: Orange Wave 1 of Navy Blue Wave 1 appears completed; Orange Wave 2 is currently in progress.
-
Wave cancel invalidation level: 1.20977.
This analysis examines the GBPUSD currency pair using Elliott Wave Theory on a four-hour chart, indicating a counter-trend correction. The primary focus is on Orange Wave 2, which follows the completion of Orange Wave 1 within the larger Navy Blue Wave 1.
With Orange Wave 1 appearing complete, the market has now entered the corrective phase of Orange Wave 2. This phase represents a short-term pullback within the broader bullish trend. Upon the conclusion of Orange Wave 2, the market is expected to transition into Orange Wave 3, resuming the upward momentum with a higher-degree impulsive wave.
The set invalidation level of 1.20977 serves as a critical reference. A price drop below this point would invalidate the current wave count, necessitating a reassessment of the market outlook.
Summary
The GBPUSD four-hour chart analysis highlights an ongoing corrective phase with the presence of Orange Wave 2 within Navy Blue Wave 1. The completion of Orange Wave 1 signals a pullback, expected to provide a foundation for the upcoming Orange Wave 3, which could drive further bullish momentum. The invalidation level acts as a key benchmark for risk management and wave count confirmation. This structured analysis equips traders with valuable insights into the current corrective movement and offers guidance on potential future trends following Elliott Wave principles.
GBP/USD Elliott Wave technical analysis [Video]
Author

Peter Mathers
TradingLounge
Peter Mathers started actively trading in 1982. He began his career at Hoei and Shoin, a Japanese futures trading company.


