GBP/USD Elliott Wave technical analysis [Video]
![GBP/USD Elliott Wave technical analysis [Video]](https://editorial.fxstreet.com/images/Markets/Currencies/Majors/GBPUSD/british-banknotes-14144912.jpg)
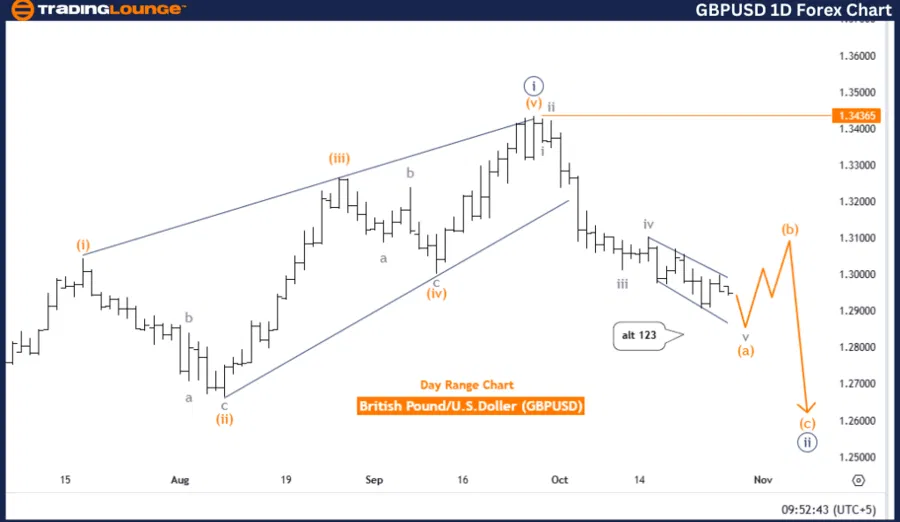
GBP/USD Elliott Wave technical analysis
-
Function: Counter Trend.
-
Mode: Impulsive.
-
Structure: Orange Wave A.
-
Position: Navy Blue Wave 2.
-
Direction next higher degrees: Orange Wave B.
Details: The ongoing Elliott Wave analysis for GBPUSD on the daily chart indicates a counter-trend structure featuring an impulsive wave (orange wave A) currently active within navy blue wave 2. This configuration suggests that orange wave A operates as a corrective phase within the broader downtrend and is nearing completion. When orange wave A finalizes, orange wave B is expected to initiate, leading to a temporary corrective phase or consolidation, diverging from the prevailing downtrend.
Positioning of navy blue wave 2: Navy blue wave 2 remains active, though it is nearing its endpoint, paving the way for the transition to orange wave B. In Elliott Wave theory, such a shift often implies a short-term reversal or a pause in the prevailing trend, providing traders insight into a likely corrective move.
Wave cancellation level: The invalidation level for this wave structure is defined at 1.34365, a crucial point in the analysis. Should the price break above this level, the current wave setup would be void, indicating a potential trend shift that would call for a reassessment of the Elliott Wave analysis. As long as the price remains below this threshold, the projected progression toward orange wave B is likely, reinforcing the counter-trend scenario.
Summary
The GBPUSD daily chart depicts a counter-trend scenario in which orange wave A is close to completion and is expected to transition into orange wave B. This anticipated shift may lead to a corrective phase within the broader wave framework, with 1.34365 identified as the critical level for confirming this wave structure. The next phase is likely to moderate the downtrend temporarily as the progression from wave A to wave B unfolds.
GBP/USD Elliott Wave technical analysis
-
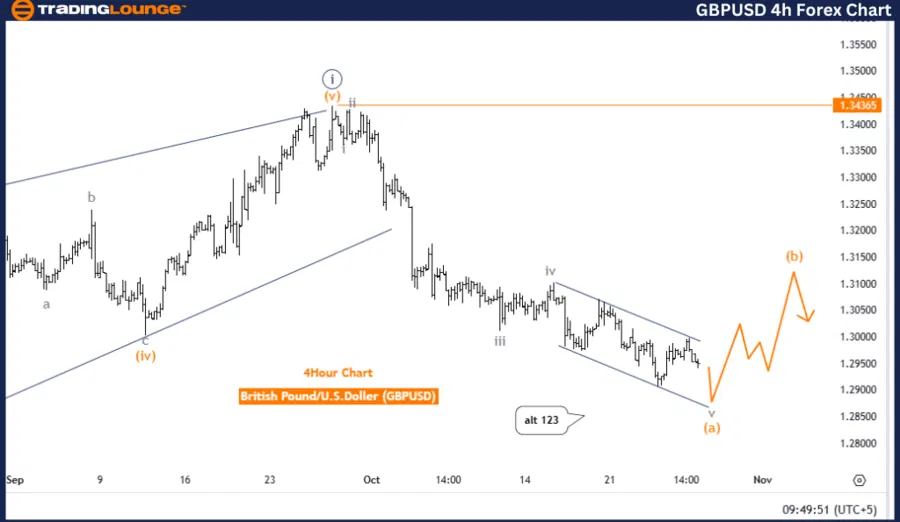
Function: Counter Trend
-
Mode: Impulsive
-
Structure: Orange Wave A
-
Position: Navy Blue Wave 2
-
Direction next higher degrees: Orange Wave B
Details: The four-hour Elliott Wave analysis for GBPUSD highlights a counter-trend movement within an impulsive structure, specifically orange wave A. Currently positioned in navy blue wave 2, GBPUSD forms part of the larger orange wave A structure, indicating a temporary corrective phase against the prevailing trend. The analysis suggests that orange wave A is nearing completion, potentially setting up a transition to orange wave B, which could introduce a reversal or a temporary corrective phase.
Impulsive and corrective waves: In Elliott Wave analysis, impulsive waves like wave A typically reflect significant directional movement, while corrective waves, such as wave B, suggest pullbacks or retracements in the opposite direction. The shift from wave A to wave B could signal a change in sentiment or market positioning as traders adjust to the expected end of wave A. If orange wave A concludes as anticipated, it will likely lead to a corrective phase under orange wave B, embodying a counter-trend within the larger wave cycle.
Wave cancellation level: The cancellation level for this wave structure is set at 1.34365, a critical threshold. Breaching this level would invalidate the current wave count, necessitating a reassessment of the trend outlook. Provided GBPUSD remains above this level, the current Elliott Wave structure remains intact.
Summary
On the GBPUSD 4-hour chart, the analysis reflects an impulsive counter-trend movement under orange wave A, potentially transitioning to orange wave B. The short-term outlook depends on the completion of wave A, with 1.34365 as a key support level to confirm the structure’s validity. The current wave pattern suggests a likely corrective reversal as wave B enters.
GBP/USD Elliott Wave technical analysis [Video]
Author

Peter Mathers
TradingLounge
Peter Mathers started actively trading in 1982. He began his career at Hoei and Shoin, a Japanese futures trading company.


