GBP/USD Elliott Wave technical analysis [Video]
![GBP/USD Elliott Wave technical analysis [Video]](https://editorial.fxstreet.com/images/Markets/Currencies/Majors/GBPUSD/iStock-1178148633.jpg)
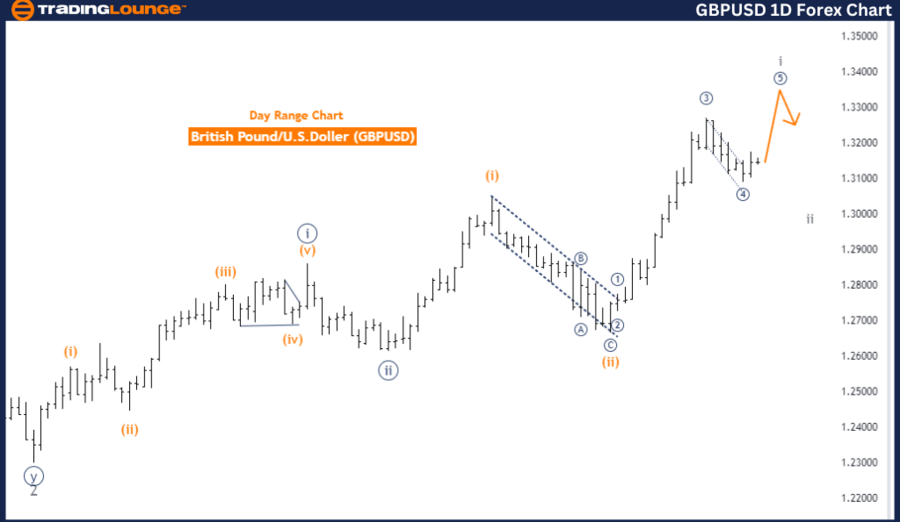
GBPUSD Elliott Wave Analysis Trading Lounge Day Chart,
British Pound/U.S. Dollar (GBPUSD) Day Chart.
GBP/USD Elliott Wave technical analysis
Function: Trend.
Mode: Impulsive.
Structure: Gray wave 1.
Position: Orange wave 3.
Direction next lower degrees: Gray wave 2.
Details: Orange wave 2 of 3 seems completed; now gray wave 1 of 3 is active.
The GBPUSD daily chart analysis shows that the British Pound to US Dollar currency pair is currently trending in an impulsive manner. The market follows an impulsive wave structure, indicating a strong directional movement consistent with the prevailing trend. The specific structure under analysis is gray wave 1, part of a larger wave sequence.
At this stage, the market is positioned in orange wave 3, which represents a crucial phase in the ongoing wave cycle. After the completion of orange wave 2 of 3, gray wave 1 of 3 has begun. This indicates that the market is progressing through the early stage of this wave, which typically results in significant price movements.
The analysis further suggests that orange wave 2 of 3 has likely completed. This marks the transition to the next phase, with gray wave 1 of 3 now unfolding. This implies the market is expected to continue moving upward in line with the current impulsive wave structure.
In summary, the GBPUSD pair remains in an impulsive trend, with gray wave 1 of 3 now unfolding. The completion of orange wave 2 of 3 signals the market's transition into gray wave 1 of 3, indicating sustained momentum within the current trend. This wave analysis offers valuable insights for traders, suggesting that the next wave cycle may involve continued upward movement.
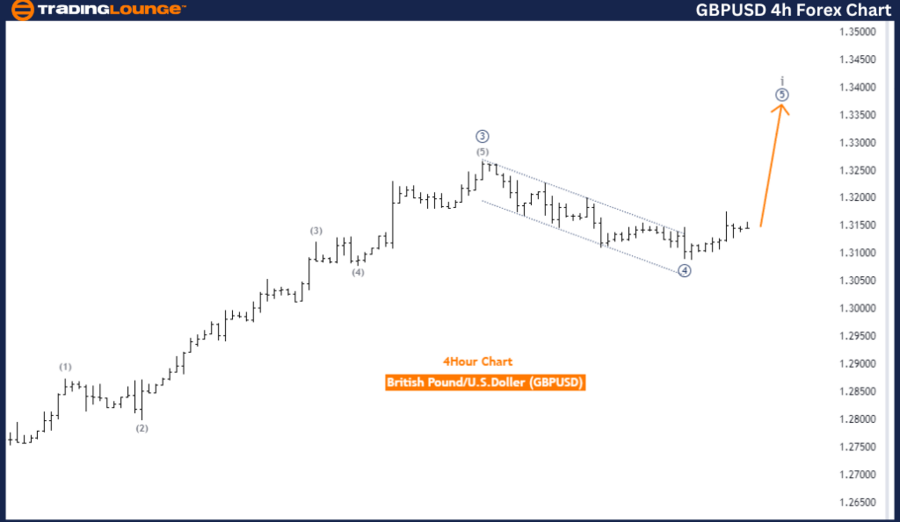
British Pound/U.S. Dollar (GBPUSD) 4-Hour Chart
GBP/USD Elliott Wave technical analysis
Function: Trend.
Mode: Impulsive.
Structure: Micro navy blue wave 5.
Position: Gray wave 1.
Direction next lower degrees: Gray wave 2.
Details: Micro navy blue wave 4 of 1 seems completed, now micro navy blue wave 5 of 1 is active.
The GBPUSD 4-hour chart analysis suggests that the British Pound to US Dollar currency pair is currently in a trending mode. The market is following an impulsive wave structure, indicating strong momentum in line with the current trend. The structure being tracked is micro navy blue wave 5, which forms part of a larger wave movement.
At the moment, the GBPUSD pair is positioned in gray wave 1, indicating the early stage of a broader wave cycle. The next lower-degree wave is gray wave 2, expected to follow the completion of the current wave.
An important detail in this analysis is that micro navy blue wave 4 of 1 appears to have completed. Now, the market is unfolding micro navy blue wave 5 of 1. This phase typically represents the final movement in the current impulse wave sequence, leading to the completion of the overall wave 1 cycle.
In summary, the GBPUSD pair is currently experiencing an impulsive trend, with micro navy blue wave 5 of 1 in progress. The completion of micro navy blue wave 4 indicates that the market is in the final phase of this impulsive sequence, with gray wave 2 expected to follow. This analysis provides insight into the ongoing wave structure and the potential transition into the next phase. Traders should closely monitor the behavior of wave 5 and prepare for the possible shift into wave 2.
Technical analyst: Malik Awais.
GBP/USD Elliott Wave technical analysis [Video]
Author

Peter Mathers
TradingLounge
Peter Mathers started actively trading in 1982. He began his career at Hoei and Shoin, a Japanese futures trading company.


