GBP/USD Elliott Wave technical analysis [Video]
![GBP/USD Elliott Wave technical analysis [Video]](https://editorial.fxstreet.com/images/Markets/Currencies/Majors/GBPUSD/iStock-472155766.jpg)
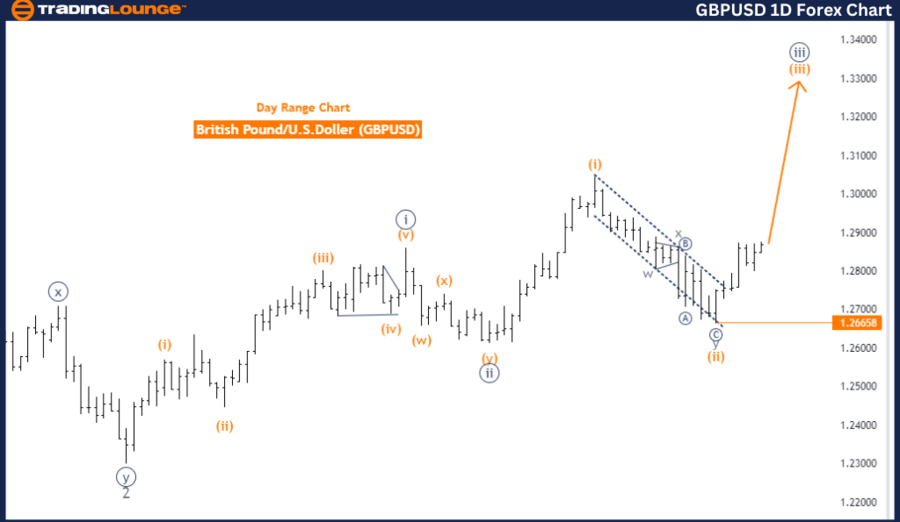
GBPUSD Elliott Wave Analysis Trading Lounge Day Chart,
British Pound/U.S. Dollar (GBPUSD) Day Chart.
GBP/USD Elliott Wave technical analysis
Function: Trend.
Mode: Impulsive.
Structure: Orange Wave 3.
Position: Navy Blue Wave 3.
Direction next lower degrees: Orange Wave 4.
Details: Orange Wave 2 appears to be completed, with Orange Wave 3 now unfolding.
Wave cancel invalid level: 1.26658.
The GBPUSD day chart, interpreted through Elliott Wave theory, highlights a trend in an impulsive mode. The current wave structure under observation is Orange Wave 3, indicating a strong upward momentum in the market. This wave forms part of a larger Navy Blue Wave 3, which suggests that the overall trend remains bullish.
At present, the market is positioned within Navy Blue Wave 3, following the completion of Orange Wave 2. This implies that the corrective phase in Orange Wave 2 has likely ended, with the market now advancing into Orange Wave 3. As this impulsive wave progresses, it is expected to drive the market higher, consistent with the prevailing bullish trend.
The analysis also forecasts the next lower degree, Orange Wave 4, which is expected to follow once Orange Wave 3 completes. Typically, Orange Wave 4 would represent a corrective phase within the broader trend before the market resumes its upward movement in the next impulsive wave.
The Wave Cancel Invalid Level is set at 1.26658, serving as a crucial threshold in this Elliott Wave analysis. Should the price fall below this level, it would invalidate the current wave count, indicating that the market might be following an alternative wave pattern or that the trend structure has shifted.
In conclusion, the GBPUSD day chart is in an impulsive trend mode, with the market currently within Orange Wave 3, part of a larger Navy Blue Wave 3 structure. The completion of Orange Wave 2 indicates that the market is now progressing, with Orange Wave 3 actively in play. The Wave Cancel Invalid Level at 1.26658 is a key level to confirm the continuation of this analysis.
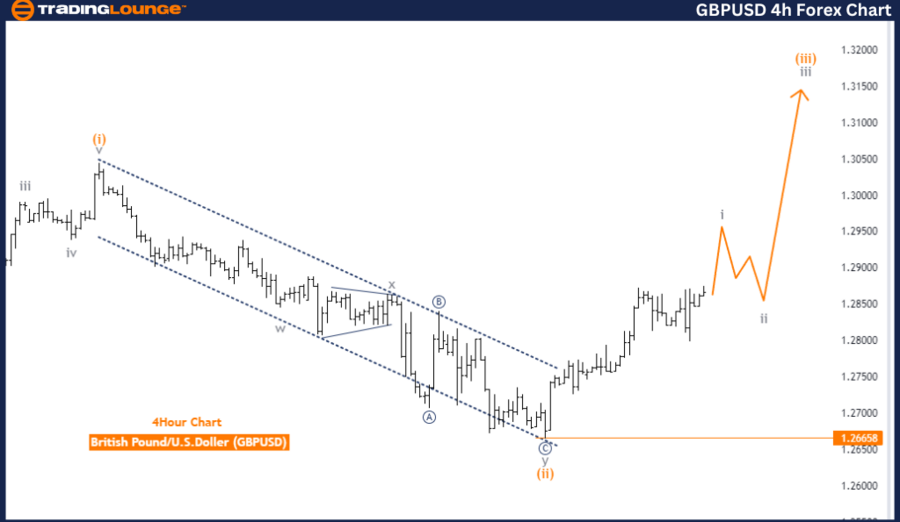
British Pound/U.S. Dollar (GBPUSD) 4 Hour Chart.
GBP/USD Elliott Wave technical analysis
Function: Trend.
Mode: Impulsive.
Structure: Gray Wave 1.
Position: Orange Wave 3.
Direction next lower degrees: Gray Wave 2.
Details: Orange Wave 2 of 3 appears to be completed, with Gray Wave 1 of 3 now unfolding.
Wave cancel invalid level: 1.26658.
The GBPUSD 4-hour chart, analyzed through Elliott Wave theory, highlights a trend in an impulsive mode. The current wave structure being observed is Gray Wave 1, which is part of a larger Orange Wave 3 formation. This suggests that the market is in a strong momentum phase, driving the price in a clear upward direction.
Currently, the market is positioned within Orange Wave 3, following the completion of Orange Wave 2 of 3. This implies that the corrective phase within Orange Wave 2 has likely concluded, with the market now advancing into Gray Wave 1 of 3. This movement indicates the beginning of a new impulsive wave within the broader trend, typically leading to further price increases consistent with the prevailing trend.
The analysis anticipates the next lower degree as Gray Wave 2, expected to follow after Gray Wave 1 is fully developed. This suggests that once Gray Wave 1 of 3 is complete, the market may enter a minor corrective phase before resuming its upward trajectory within Gray Wave 3.
The Wave Cancel Invalid Level is set at 1.26658, serving as a crucial point for validating this wave count. If the price drops below this level, it would invalidate the current Elliott Wave analysis, indicating that an alternative wave pattern might be emerging or that the trend structure has altered.
In summary, the GBPUSD 4-hour chart is in an impulsive trend mode, with the market currently within Gray Wave 1 of 3 as part of the larger Orange Wave 3 structure. The completion of Orange Wave 2 suggests that the market is now advancing, with Gray Wave 1 in progress. The Wave Cancel Invalid Level at 1.26658 is critical for confirming the continuation of this analysis.
Technical analyst: Malik Awais.
GBP/USD Elliott Wave technical analysis [Video]
Author

Peter Mathers
TradingLounge
Peter Mathers started actively trading in 1982. He began his career at Hoei and Shoin, a Japanese futures trading company.


