GBP/USD Elliott Wave technical analysis [Video]
![GBP/USD Elliott Wave technical analysis [Video]](https://editorial.fxstreet.com/images/Markets/Currencies/Majors/GBPUSD/iStock-1078115946.jpg)
GBPUSD Elliott Wave technical analysis
Function: Trend.
Mode: Impulsive.
Structure: Orange Wave 3.
Position: Navy Blue Wave 3.
Direction next higher degrees: Orange Wave 3 (started).
Details: Orange Wave 2 of 3 appears completed, now Orange Wave 3 is in progress.
Wave cancel invalid level: 1.26658.
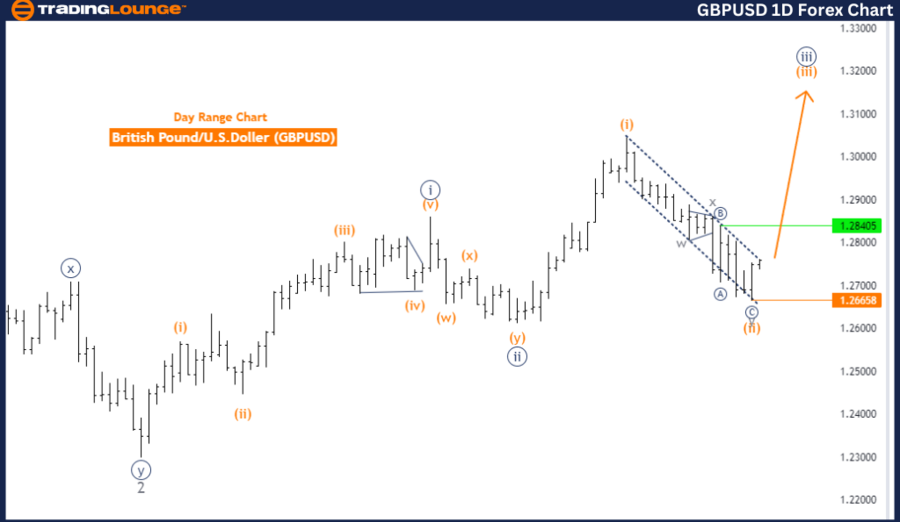
The GBPUSD Elliott Wave Analysis on the daily chart concentrates on a trending market with an impulsive mode, indicating a strong upward momentum. The wave structure under review is Orange Wave 3, which suggests the market is in the midst of a significant upward trend as part of a larger impulsive wave sequence.
Currently, the market is positioned in Navy Blue Wave 3. This wave positioning indicates the market's continued upward progression within the ongoing impulsive wave, contributing to the overall trend. The analysis indicates that the direction for the next higher degrees aligns with the continuation of Orange Wave 3, which has already begun and is propelling the market further upward.
The analysis observes that Orange Wave 2 of 3 seems to have completed, marking the end of the corrective phase within the current wave structure. This completion allows the market to transition into Orange Wave 3, an impulsive wave expected to maintain the upward momentum. This transition is crucial as it signifies a shift from consolidation to a more assertive upward movement in the GBPUSD pair.
The wave cancel invalid level is set at 1.26658, serving as a critical threshold for this analysis. If the market were to fall below this level, it would invalidate the current wave structure, indicating that the expected progression from Orange Wave 2 to Orange Wave 3 is not happening as predicted. Such a scenario would necessitate a reevaluation of the wave count and the overall market outlook.
In summary, the GBPUSD Elliott Wave Analysis on the daily chart underscores a strong upward trend within an impulsive wave structure. The market is currently in Navy Blue Wave 3, with Orange Wave 2 completed and Orange Wave 3 now in progress. The wave cancellation invalid level at 1.26658 is crucial for confirming the validity of this analysis.
GBP/USD day chart
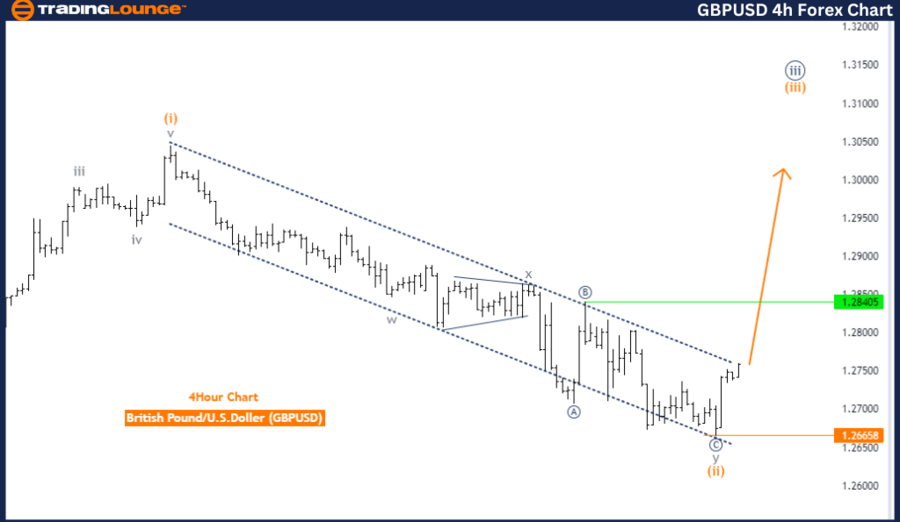
GBP/USD four-hour chart
Function: Trend
Mode: Impulsive
Structure: Orange Wave 3
Position: Navy Blue Wave 3
Direction next higher degrees: Orange Wave 3 (started)
Details: Orange Wave 2 of 3 appears completed, now Orange Wave 3 is in progress.
Wave cancel invalid level: 1.26658
The GBPUSD Elliott Wave Analysis on the 4-hour chart concentrates on a trending market characterized by an impulsive mode. This analysis indicates that the market is currently moving in a strong upward direction. The specific wave structure under observation is Orange Wave 3, which is part of a larger impulsive pattern.
At this stage, the market is positioned in Navy Blue Wave 3. This positioning suggests that the market is experiencing a significant rise as part of the broader trend driven by the impulsive wave structure. The analysis underscores that the direction for the next higher degrees is aligned with the continuation of Orange Wave 3, which has already begun and is expected to propel the market higher.
A crucial detail in this analysis is the completion of Orange Wave 2 of 3. This marks the end of the corrective phase within the current wave structure. With Orange Wave 2 completed, the market has now entered Orange Wave 3, an impulsive wave expected to continue driving the market upward in line with the overall trend.
The wave cancel invalid level is set at 1.26658. This level is essential for validating the current wave count and analysis. If the GBPUSD were to fall below this level, it would invalidate the existing wave structure, indicating that the anticipated progression from Orange Wave 2 to Orange Wave 3 is not unfolding as expected. Such a scenario would necessitate a reevaluation of the wave count and the overall market direction.
In summary, the GBPUSD Elliott Wave Analysis on the 4-hour chart highlights a strong upward trend within the impulsive wave structure, with the market currently in Navy Blue Wave 3. The completion of Orange Wave 2 has led to the start of Orange Wave 3, which is driving the market higher. The wave cancellation invalid level at 1.26658 is critical for maintaining the validity of this analysis.
GBP/USD Elliott Wave technical analysis [Video]
Author

Peter Mathers
TradingLounge
Peter Mathers started actively trading in 1982. He began his career at Hoei and Shoin, a Japanese futures trading company.


