GBP/USD Elliott Wave technical analysis [Video]
![GBP/USD Elliott Wave technical analysis [Video]](https://editorial.fxstreet.com/images/Markets/Currencies/Majors/GBPUSD/iStock-157771037.jpg)
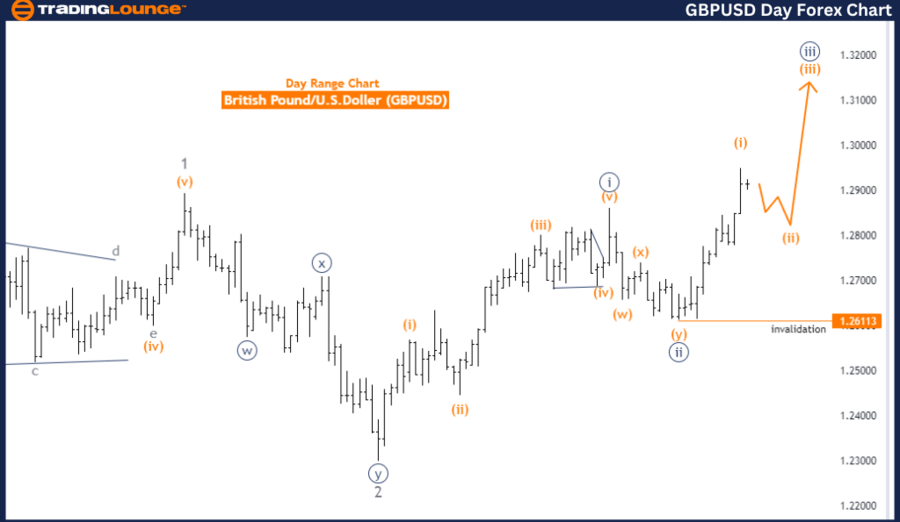
GBPUSD Elliott Wave Analysis Trading Lounge Day Chart.
GBP/USD day chart analysis
Elliott Wave Technical Analysis.
Function: Trend.
Mode: Impulsive.
Structure: Navy Blue Wave 3.
Position: Gray Wave 3.
Direction next higher degrees: Navy Blue Wave 3 (Continue).
Details: Navy Blue Wave 2 looking completed, now Navy Blue Wave 3 is in play.
Wave cancel invalid level: 1.26113.
The GBPUSD Elliott Wave Analysis on the day chart focuses on an impulsive trend movement, indicating a strong market direction with significant momentum. The current wave structure under analysis is Navy Blue Wave 3, positioned within Gray Wave 3. This means the market is in the third wave of a larger third wave sequence, suggesting a powerful trend continuation.
The direction of the next higher degrees continues within Navy Blue Wave 3, indicating that the strong trend movement is expected to persist. This phase shows that Navy Blue Wave 2 is considered complete, meaning the market has finished its corrective phase and is now fully engaged in Navy Blue Wave 3.
Currently, Navy Blue Wave 3 is in play, signifying an ongoing impulsive movement with strong market momentum. The wave cancel invalid level is set at 1.26113. If the market price drops below this level, it would invalidate the current wave analysis, indicating a major shift in the market’s direction and potentially a reevaluation of the wave structure.
In summary, the GBPUSD day chart analysis identifies a strong, impulsive trend within the Elliott Wave framework. The market is positioned within Navy Blue Wave 3, specifically in Gray Wave 3, following the completion of Navy Blue Wave 2. This suggests a continuation of the strong trend movement. The wave cancel invalid level at 1.26113 is critical for validating this analysis, as a drop below this level would indicate a significant change in market dynamics and invalidate the current wave structure.
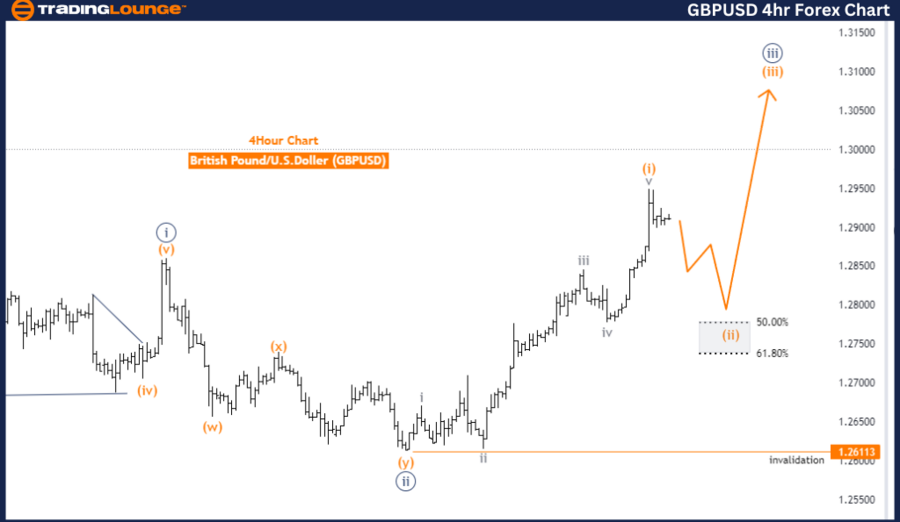
GBPUSD Elliott Wave Analysis Trading Lounge 4 Hour Chart
GBPUSD four-hour chart analysis
Elliott Wave Technical Analysis.
Function: Counter Trend.
Mode: Corrective.
Structure: Orange Wave 2.
Position: Navy Blue Wave 3.
Direction next higher degrees: Orange Wave 3.
Details: Orange Wave 1 looking completed at 1.29503, now Orange Wave 2 is in play.
Wave cancel invalid level: 1.26113.
The GBPUSD Elliott Wave Analysis on the 4-hour chart focuses on a counter-trend movement, categorized as corrective. This indicates that the market is currently in a phase where it is moving against the prevailing trend, adjusting or retracing before potentially resuming the main trend. The wave structure under review is Orange Wave 2, positioned within Navy Blue Wave 3. This suggests that the market is in the second corrective wave of a larger third wave sequence.
The next anticipated phase in the wave structure is Orange Wave 3, which will follow the completion of the current Orange Wave 2. This upcoming phase is expected to be an impulsive wave, indicating a resumption of the main trend direction, likely with stronger movement compared to the corrective wave currently in play.
A key detail in the analysis is that Orange Wave 1 is considered to have been completed at the price level of 1.29503. Currently, Orange Wave 2 is in play, meaning the market is undergoing a corrective phase at this stage. The wave cancel invalid level is set at 1.26113. If the market price falls below this level, the current wave analysis would be invalidated, suggesting a significant shift in market dynamics.
In summary, the GBPUSD 4-hour chart analysis identifies a counter-trend movement within the Elliott Wave framework. The market is in a corrective phase represented by Orange Wave 2 within Navy Blue Wave 3, following the completion of Orange Wave 1 at 1.29503. The analysis anticipates that the next phase will be Orange Wave 3, indicating a potential resumption of the main trend direction. The wave cancellation invalid level at 1.26113 is crucial for validating the current wave structure analysis.
Technical analyst: Malik Awais.
GBPUSD four-hour chart analysis [Video]
Author

Peter Mathers
TradingLounge
Peter Mathers started actively trading in 1982. He began his career at Hoei and Shoin, a Japanese futures trading company.


