GBP/USD Elliott Wave technical analysis [Video]
![GBP/USD Elliott Wave technical analysis [Video]](https://editorial.fxstreet.com/images/Markets/Currencies/Majors/GBPUSD/strong-pound-weak-dollar-17536259_XtraLarge.jpg)
GBP/USD Elliott Wave technical analysis
Function: Trend.
Mode: impulsive.
Structure: Red wave 3.
Position: Blue wave 5.
Direction next lower degrees: Red wave 4.
Details: Red wave 2 of blue wave 5 completed , now sub waves of red wave 3 of 5 are in play. Wave Cancel invalid level: 1.27094.
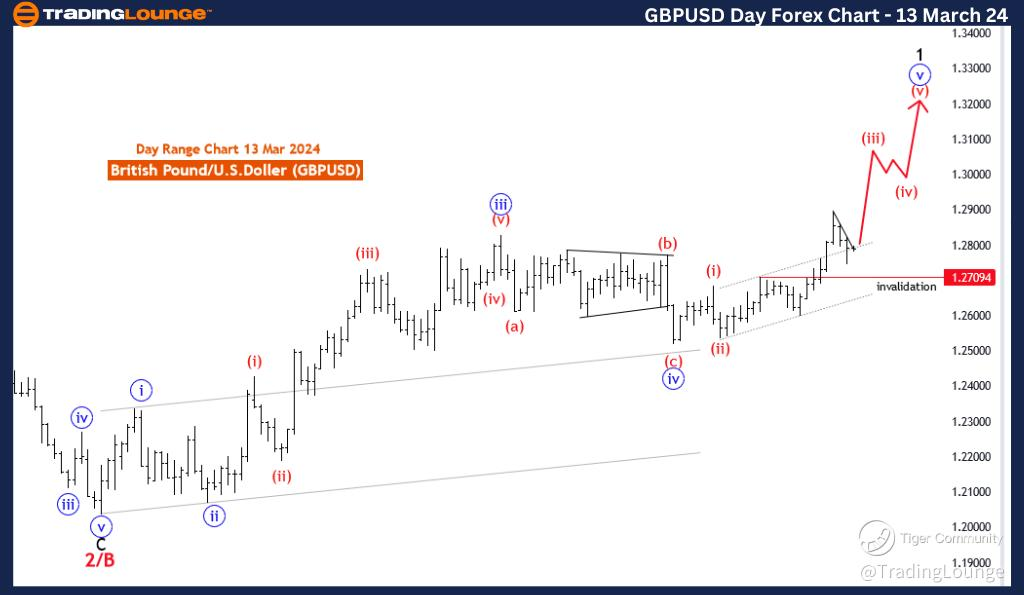
The GBP/USD Elliott Wave Analysis for the day chart on 13 March 24, offers a comprehensive evaluation of potential price movements in the British Pound/U.S. Dollar currency pair, utilizing Elliott Wave principles within the context of technical analysis.
The identified "FUNCTION" is "Trend," signifying a focus on capturing and interpreting directional movements within the overarching trend. This suggests an inclination towards sustained and significant price trends.
The specified "MODE" is characterized as "Impulsive," indicating that the market is currently in a phase marked by strong, directional moves. Impulsive phases often represent substantial and prolonged price trends.
The "STRUCTURE" is denoted as "Red wave 3," highlighting the current impulsive wave within the Elliott Wave count. In Elliott Wave theory, impulsive waves are marked by powerful, directional price movements following the prevailing trend.
The "POSITION" is described as "blue wave 5," indicating the placement of the current impulsive wave within the larger Elliott Wave structure. Blue wave 5 signifies a lower-degree wave within the ongoing Elliott Wave count.
"DIRECTION NEXT LOWER DEGREES" is identified as "red wave 4," suggesting the anticipated direction for the subsequent lower-degree wave. This implies an expectation of a corrective phase following the completion of the current impulsive wave.
In the "DETAILS" section, it is mentioned that "Red wave 2 of blue wave 5 completed, now sub waves of red wave 3 of 5 are in play." This signifies the conclusion of the corrective phase (Red wave 2) and the initiation of the next impulsive wave (sub waves of red wave 3 of 5).
The "Wave Cancel invalid level" is set at 1.27094, serving as a critical reference point. A breach beyond this level would invalidate the current wave count, necessitating a reassessment of the analysis.
In summary, the GBP/USD Elliott Wave Analysis for the day chart on 13 March 24, suggests an ongoing impulsive phase labeled as Red wave 3 within the broader context of blue wave 5. The analysis anticipates a corrective phase (red wave 4) following the completion of the current impulsive wave. The Wave Cancel invalid level at 1.27094 serves as a pivotal threshold for monitoring potential shifts in the wave count and trend dynamics.
GBP/USD Elliott Wave technical analysis
Function: Trend.
Mode: impulsive.
Structure: black wave 5.
Position: Red wave 3.
Direction next lower degrees: Red wave 4.
Details: Red wave 4 of blue wave 5 completed, now black wave 5 of 3 is in play. Wave Cancel invalid level: 1.27094
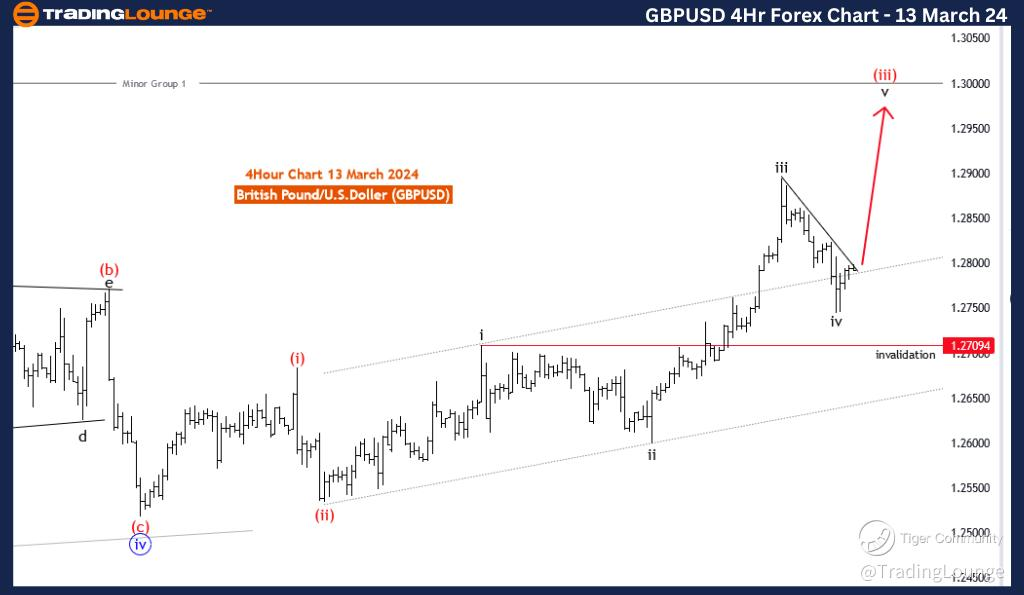
The GBP/USD Elliott Wave Analysis for the 4-hour chart on 13 March 24, provides an insightful assessment of potential price movements in the British Pound/U.S. Dollar currency pair. The analysis utilizes the Elliott Wave principles within the framework of technical analysis.
The "FUNCTION" is identified as "Trend," signaling a focus on capturing and understanding the directional movements within the overarching trend. This implies an inclination towards sustained price movements.
The "MODE" is characterized as "Impulsive," indicating that the market is currently in a phase marked by strong, directional moves. Impulsive phases typically represent significant and sustained price trends.
The "STRUCTURE" is specified as "black wave 5," highlighting the current impulsive wave within the Elliott Wave count. In Elliott Wave theory, impulsive waves are characterized by strong, directional price movements that follow the prevailing trend.
The "POSITION" is denoted as "red wave 3," representing the placement of the current impulsive wave within the larger Elliott Wave structure. Red wave 3 signifies a lower-degree wave within the ongoing Elliott Wave count.
"DIRECTION NEXT LOWER DEGREES" is indicated as "red wave 4," suggesting the expected direction for the subsequent lower-degree wave. This implies an anticipation of a corrective phase following the completion of the current impulsive wave.
In the "DETAILS" section, it is mentioned that "Red wave 4 of blue wave 5 completed, now black wave 5 of 3 is in play." This signifies the conclusion of the corrective phase (Red wave 4) and the initiation of the next impulsive wave (black wave 5 of 3). The "Wave Cancel invalid level" is set at 1.27094, serving as a critical reference point. Any breach beyond this level would invalidate the current wave count, prompting a reassessment of the analysis.
In summary, the GBP/USD Elliott Wave Analysis for the 4-hour chart on 13 March 24, suggests an ongoing impulsive phase labeled as black wave 5 within the broader context of red wave 3. The analysis anticipates a corrective phase (red wave 4) following the completion of the current impulsive wave. The Wave Cancel invalid level at 1.27094 serves as a key threshold for monitoring potential shifts in the wave count and trend dynamics.
GBP/USD Elliott Wave technical analysis [Video]
Author

Peter Mathers
TradingLounge
Peter Mathers started actively trading in 1982. He began his career at Hoei and Shoin, a Japanese futures trading company.


