|

GBP/USD Elliott Wave: Another leg down

Executive summary

  • GBP/USD continues its decline in the 2nd leg of a double zigzag pattern.
  • Though a rally to 1.3550 would be considered ‘normal’, the larger trend is down.
  • Downside targets include 1.3050-1.3139.

Back on September 19, two-days after a medium term top, we forecasted a decline in GBP/USD reaching to 1.31 and possibly 1.28. Cable has progressed lower and the Elliott wave pattern appears to be incomplete to the downside.

GBP/USD Elliott Wave count
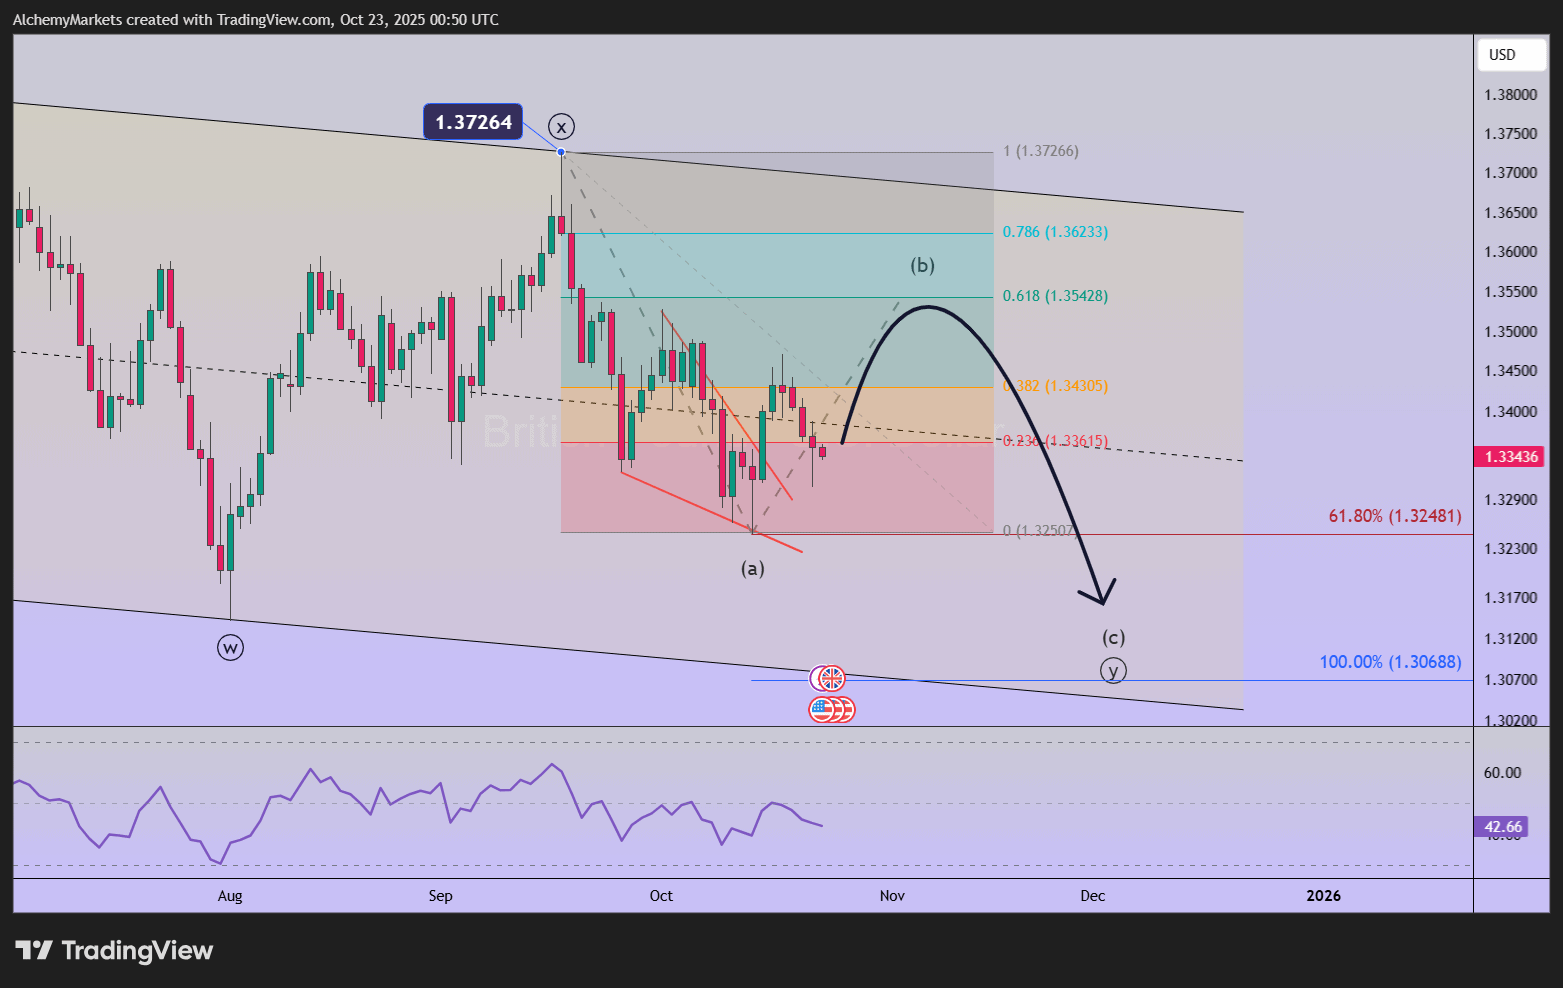
GBP/USD carved a wave ((x)) high on September 17 at 1.3726. The decline since September 17 fits best as wave ((y)). 

We know from our Elliott wave studies that this y-wave is likely to take shape as an (a)-(b)-(c) zigzag pattern.

It appears Cable is about half-way through the wave (b). It is possible GBP/USD may rally further up to 1.3550 to complete (b). Then, the next wave, wave (c) would be a motive pattern that likely digs down to 1.31 and possibly lower levels.

There are a few wave relationships appearing between 1.3050 – 1.3139 so we’ll need to see how advanced the wave structure is if price is successful in reaching down that low.

The key level to the bearish forecast is 1.3726. If GBP/USD rallies above this level, then we’ll need to reconsider a different Elliott wave pattern at play.

Bottom line

GBP/USD appears to be about halfway through its next leg lower. A rally to 1.3550 would be considered ‘normal’ within the Elliott wave structure we are following. However, the trend is still lower and the next trend may dig deeper to 1.3050-1.3139.

If 1.3726 is breached to the upside, then we’ll reconsider the wave count.

Author

Zorrays Junaid

Zorrays Junaid

Alchemy Markets

Zorrays Junaid has extensive combined experience in the financial markets as a portfolio manager and trading coach. More recently, he is an Analyst with Alchemy Markets, and has contributed to DailyFX and Elliott Wave Forecast in the past.


More from Zorrays Junaid
Share:

Editor's Picks

AUD/USD holds above 0.6950 as bullish USD caps gains

AUD/USD edges lower during the Asian session on Tuesday, stalling a two-day recovery move from a two-month low, touched last week. An extended rout in the fixed income market keeps US bond yields elevated near multi-year highs. This, along with geopolitical uncertainties, helps the US Dollar retain its bullish tone despite receding October Fed hike bets. However, expectations for another RBA rate hike this month could act as a tailwind for the Aussie.

USD/JPY rises back above 158.00 despite hawkish BoJ outlook

USD/JPY rises back above 158.00 in the early European morning on Tuesday. The pair strengthens as the Japanese Yen fails to find any inspiration from hawkish BoJ expectations and looming intervention risks. Meanwhile, geopolitical uncertainty and elevated US bond yields keep the US Dollar near its YTD high despite receding October Fed hike bets. This, in turn, helps the pair stay supported.

Gold hits two-month low as bears await break below $4,100 amid sustained USD strength

Gold attracts fresh sellers following the previous day's consolidative price move, and drops to a two-month low during the Asian session, with bears now awaiting a break below the $4,100 mark before positioning for further losses. Despite receding October Fed rate hike bets, the US Dollar retains its bullish tone and continues to undermine demand for the commodity.

Ripple and Stellar weaken as derivatives positioning fades
Ripple (XRP) and Stellar (XLM) face pressure trading below $1.499 and $0.220, respectively, on Tuesday after a modest correction at the start of the week. Traders should be cautious as weakening derivatives metrics and fading bullish momentum suggest further corrections for XRP and XLM. Derivatives data shows a weakening and cautious signal among traders.
The scarcity trade is gaining momentum – The biggest commodity moves may still be ahead
Something extraordinary is happening across global Commodity markets. Oil is above $100. Diesel has reached record prices. Copper has broken records. Global food prices are rising again. China is restricting fuel exports. Governments are releasing emergency reserves.
Eurozone inflation just hit 3.8%, its highest in three years. This chart shows why the ECB can’t simply hike its way out

The ECB would normally have a relatively straightforward answer to inflation running almost twice its target: raise interest rates. But these are not normal circumstances. This time, the bond market is already doing part of the tightening for it, leaving the ECB facing an increasingly difficult dilemma.