GBP/USD bullish reversal and breakout aiming for 1.40 target
-
The GBP/USD made a bullish bounce around 1.2830. This is the 21 ema zone and 38.2-50% Fibonacci levels of wave 4 (pink).
-
What is the main target for the Cable? Let’s review the Fibonacci levels and wave patterns.
-
A reversal pattern (red arrows) could take place via a head and shoulders chart pattern (orange boxes) at the 1.40 target.

The GBP/USD made a bullish reversal at the 1.2820-50 support zone. What is the main target for the Cable? Let’s review the Fibonacci levels and wave patterns.
Price Charts and Technical Analysis
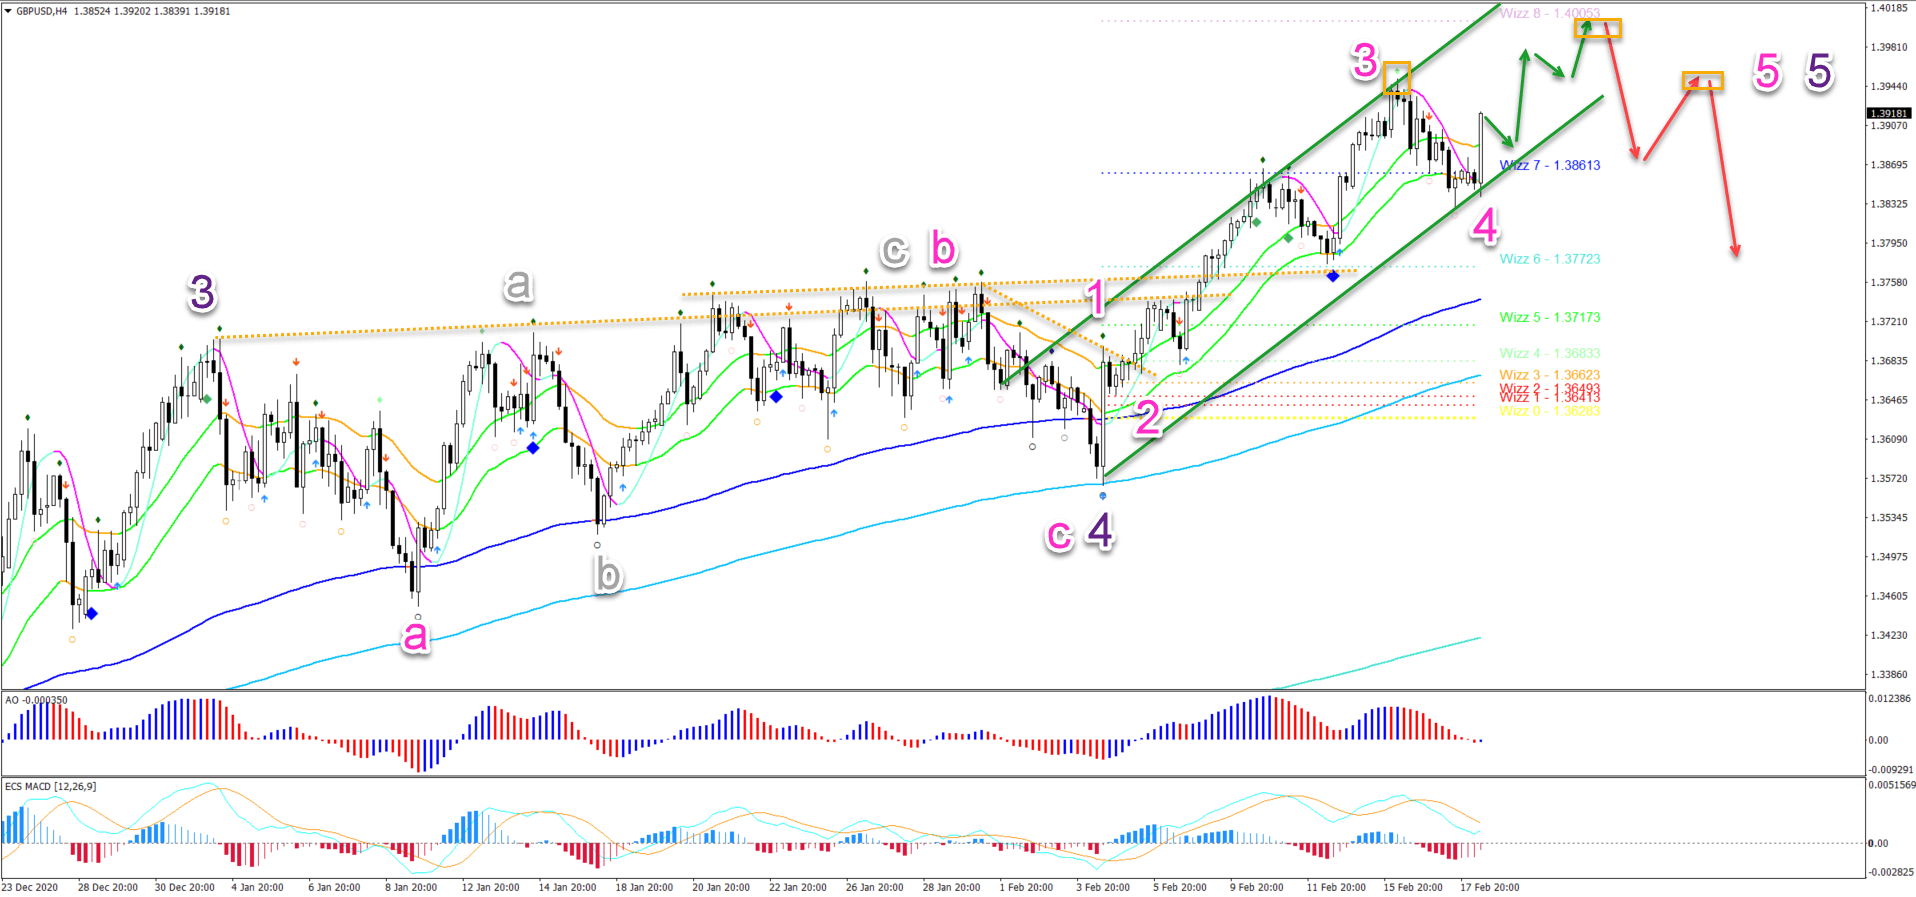
The GBP/USD made a bullish bounce around 1.2830. This is the 21 ema zone and 38.2-50% Fibonacci levels of wave 4 (pink).
Price action is now breaking above the 21 ema zone. The current 4H candle needs to close relatively near to the candle high to confirm a strong breakout.
-
A strong breakout is expected to send price action higher (green arrows) within the uptrend channel (green lines).
-
The main target is the Wizz 8 and round level at 1.40.
-
This target could indicate the end of the uptrend as price action completes a wave 5 (pink) of wave 5 (purple).
-
A reversal pattern (red arrows) could take place via a head and shoulders chart pattern (orange boxes).
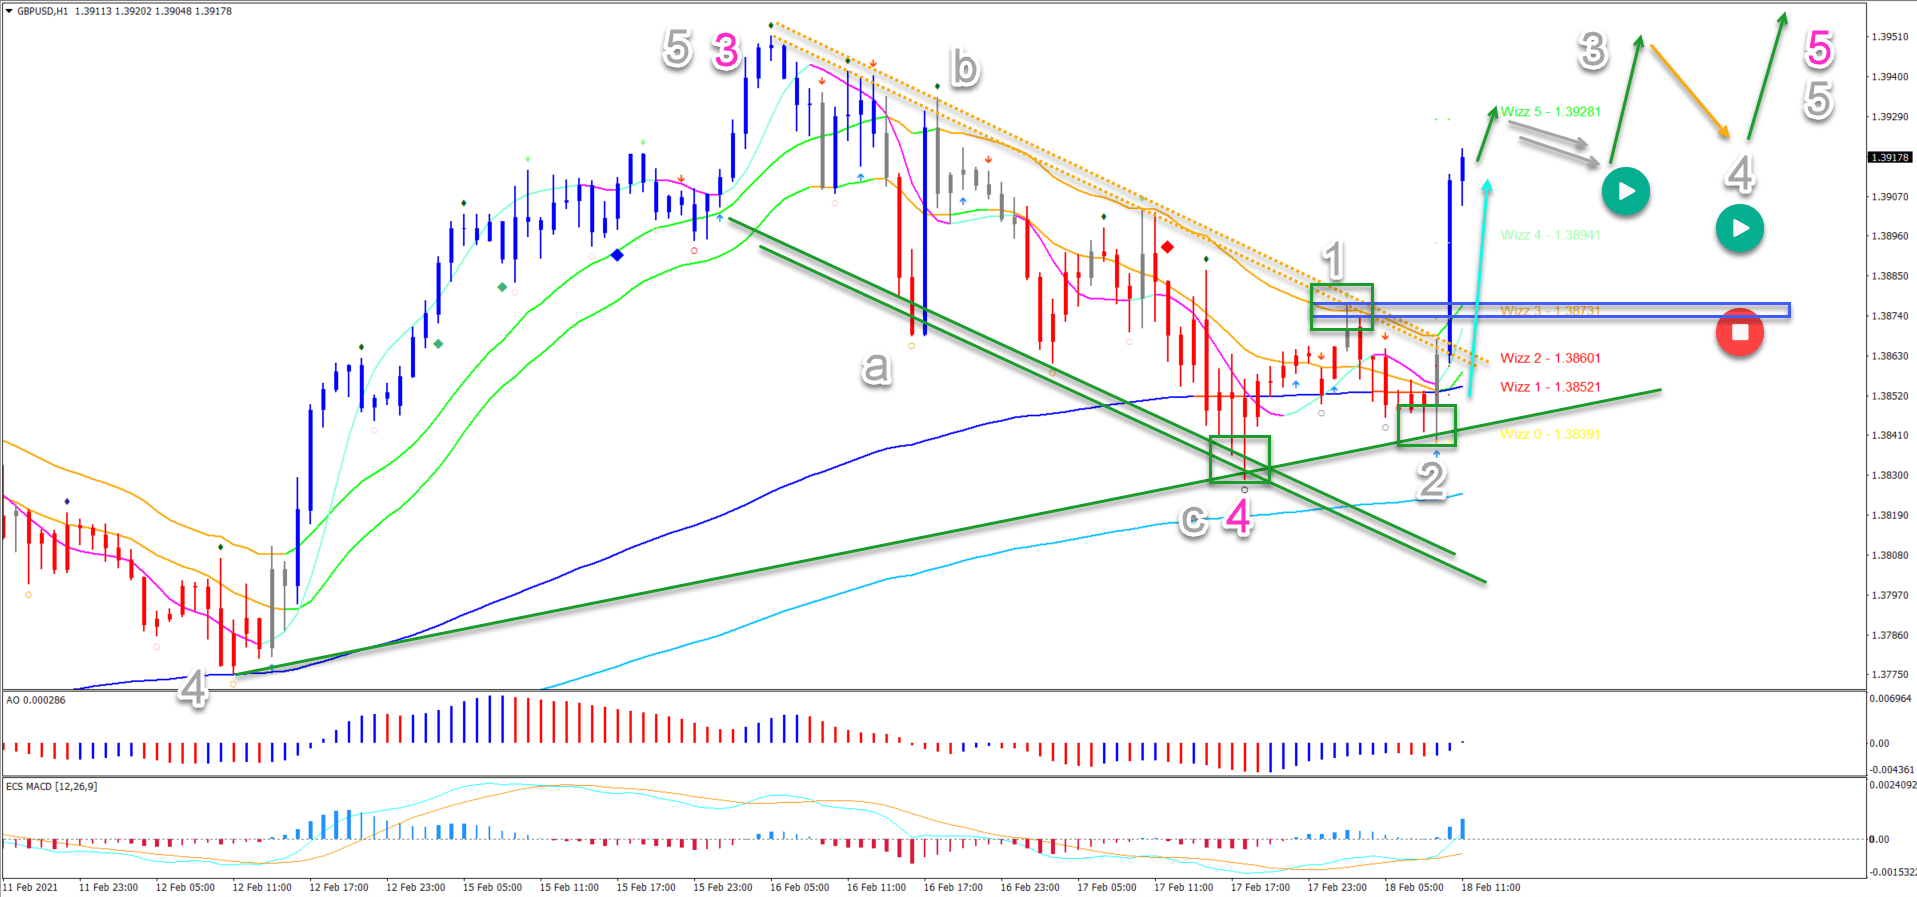
On the 1 hour chart, price action made a bearish retracement via the downtrend channel.
-
Price action bounced (green box) at the long-term moving averages of the 1 hour chart and the bottom of the downtrend channel.
-
It then created a strong push up followed by a higher low. The third swing up was an impulsive push (light blue arrow) as expected.
-
The retracement completed an ABC (grey) pattern within wave 4 (pink).
-
Now price action could push higher (green arrow) if the breakout is strong.
-
A bull flag pattern (grey arrows) could emerge followed by another new high (green arrows).
-
The uptrend remains valid (red circle) as long as price action does not enter below the support zone (blue box) and top of wave 1 (grey).
The main target is the 1.40 round level.
The analysis has been done with the ecs.SWAT method and ebook.
Author

Chris Svorcik
Elite CurrenSea
Experience Chris Svorcik has co-founded Elite CurrenSea in 2014 together with Nenad Kerkez, aka Tarantula FX. Chris is a technical analyst, wave analyst, trader, writer, educator, webinar speaker, and seminar speaker of the financial markets.


