GBP/USD bullish ABC zigzag aiming at Fibonacci resistance
-
GBP/USD has made a bullish bounce at the 144-233 ema support zone. The higher low and higher high have launched a bullish breakout.
-
The GBP/USD seems to have completed multiple wave 5s at the recent top. The 5 wave decline (purple) only supports this wave outlook.
-
On the 1 hour chart, price completed a 5 wave pattern (purple) in wave A (red). Now a bullish ABC pattern could take the price up higher.

The bullish trend channel is now the key factor for more upside. Let’s review the 4 and 1 hour charts.
Price charts and technical analysis
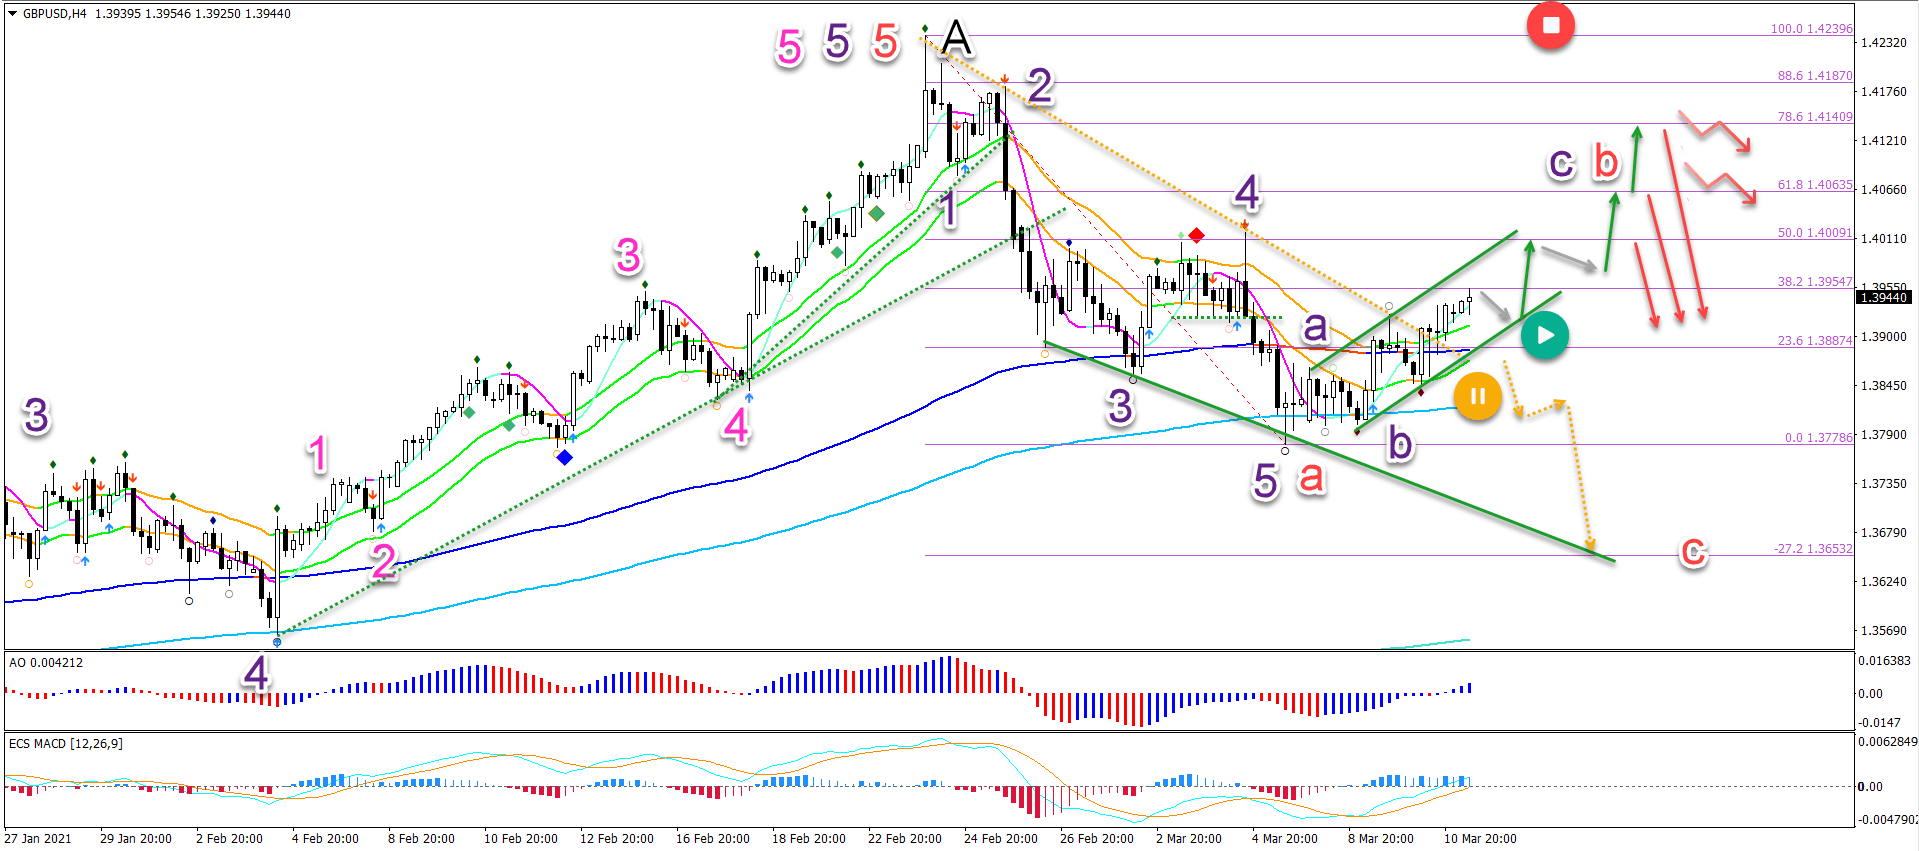
The GBP/USD seems to have completed multiple wave 5s at the recent top. The 5 wave decline (purple) only supports this wave outlook. Let’s review the key zones and patterns:
-
The bearish 5 waves completed a wave A (red).
-
A larger bearish ABC (red) pattern is expected.
-
The push up is probably an ABC (purple) within wave B (red).
-
This ABC pattern remains valid as long as price stays below the top (red circle).
-
A break (dotted orange) below the support line (green) of the uptrend channel indicates an early bearish bounce at the 38.2% Fib (yellow circle).
-
A break above the 38.2% Fib confirms a deeper bullish break towards the Fibonacci retracement levels.
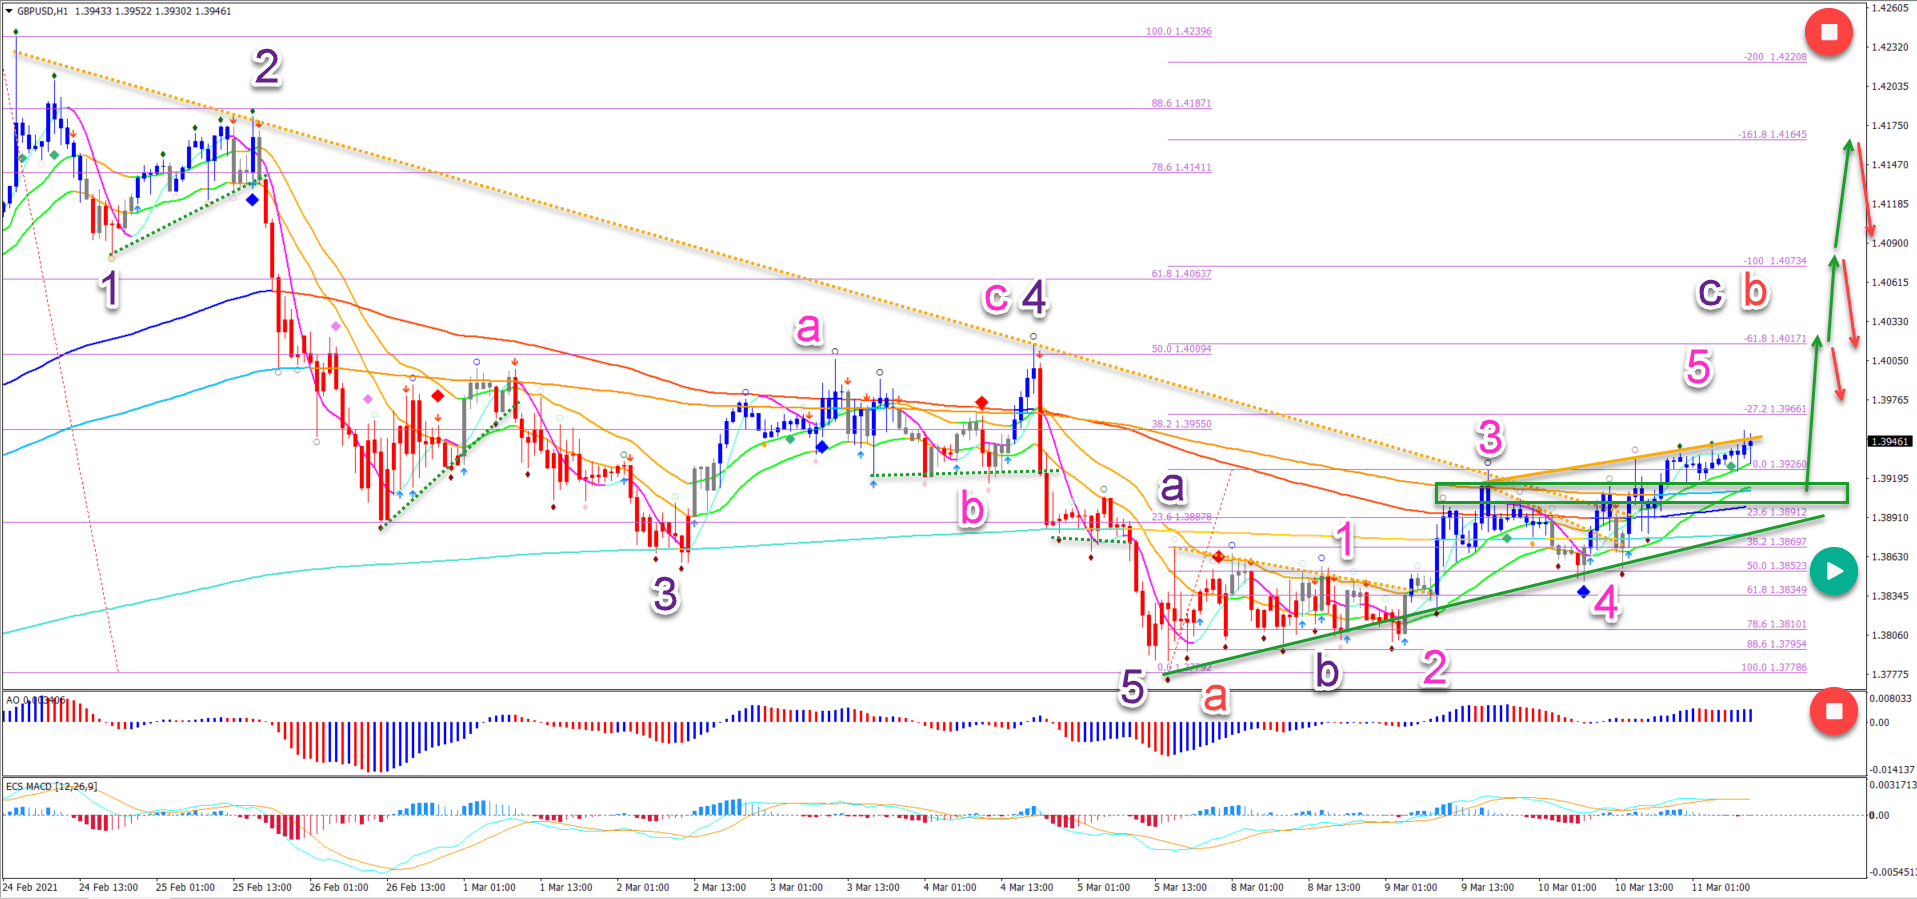
On the 1 hour chart, price completed a 5 wave pattern (purple) in wave A (red). Now a bullish ABC pattern could take the price up higher.
-
A bearish breakout below the support line (green) indicates a deeper retracement (yellow circle).
-
A break below the bottom indicates that the ABC (purple) pattern is completed sooner than expected (red circle).
-
A bounce at the support zone (green box) indicates a push up towards the Fibonacci confluence.
The analysis has been done with the ecs.SWAT method and ebook.
Author

Chris Svorcik
FS method
Chris Svorcik is a trader, analyst, and educator with over 15 years of experience in financial markets, specializing in moving averages, market structure, and price patterns.















