|

GBP/USD at breaking point: Will the bulls roar back?

  • GBP/USD falls below SMAs but one last opportunity for rebound remains.

  • Short-term signals point to oversold conditions; eyes on 1.3400.

Chart


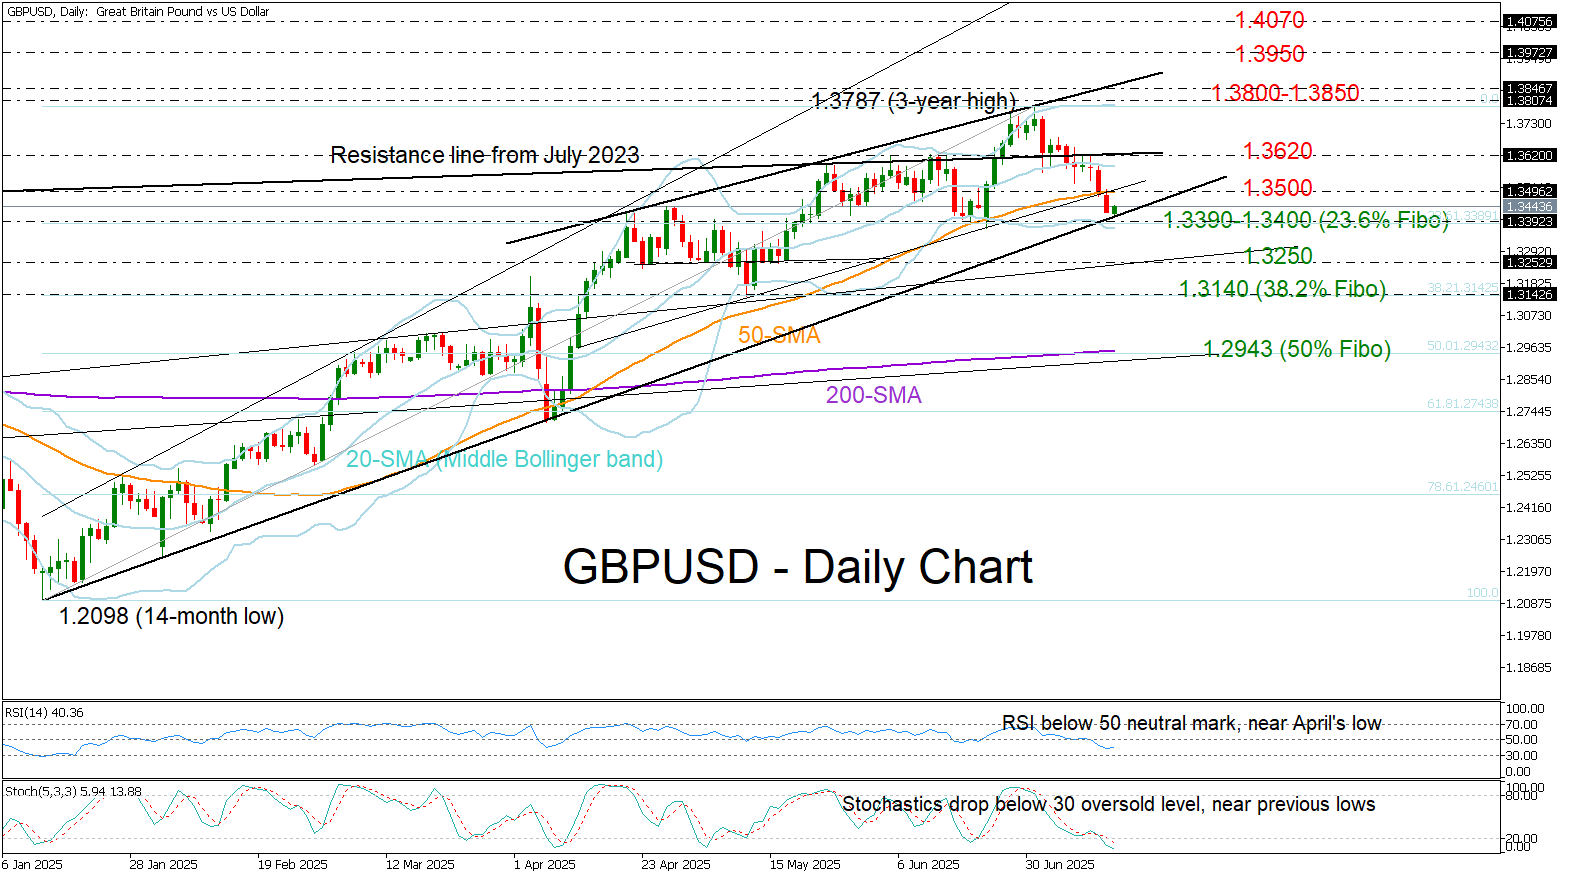
GBP/USD extended its decline below the 50-day simple moving average (SMA) after Bank of England Governor Andrew Bailey expressed a willingness to implement larger rate cuts if the labor market shows signs of weakness, according to an interview with The Times.

U.S. and UK CPI figures, due today and tomorrow respectively, are expected to show some persistence in inflation, and the pair is already hovering near a potential pivot zone, trading around the 2025 support trendline at 1.3400. Notably, the 23.6% Fibonacci retracement of the 2025 uptrend is also nearby, at 1.3390.

The stochastic oscillator has dipped into the oversold region, the price is nearing the lower Bollinger Band, and the RSI is testing its April low – all suggesting that the recent bearish cycle may be nearing exhaustion. If this proves to be the case, the bulls will need to reclaim the 50-day SMA at 1.3500 and then push past the 1.3620 barrier to target again the key 1.3800–1.3860 resistance zone.

Conversely, if selling pressure intensifies below 1.3400, the bears could aim for the 1.3250 constraining zone, followed by the May low at 1.3138. A decisive close below the latter could pave the way toward the 1.3000 level or even lower to the 50% Fibonacci of 1.2943.

In brief, GBPUSD is currently trading near a critical make-or-break point around 1.3400, with the technical picture slightly favoring a potential rebound.

Author

Christina Parthenidou

Christina joined the XM investment research department in May 2017. She holds a master degree in Economics and Business from the Erasmus University Rotterdam with a specialization in International economics.

More from Christina Parthenidou
Share:

Editor's Picks

AUD/USD falls to near 0.7100 after slipping below 50-day EMA

AUD/USD depreciates after registering minor gains in the previous day, trading around 0.7120 during the Asian hours. The technical analysis of the daily chart shows the pair consolidating sideways within a rectangle pattern, as neither bulls nor bears gain control. The AUD/USD pair is holding a slight bearish tone however as it sits beneath both the nine-day and 50-day EMAs.

160.00: USD/JPY back near intervention territory after upbeat US jobs report

US Nonfarm Payrolls beat expectations by a wide margin in May, with 172K jobs added. The US Dollar rebounds after the release, helping USD/JPY recover from its intraday lows. Warnings from Japanese authorities continue to limit upside potential near the 160.00 threshold.

Gold targets $4,300 amid stronger Dollar

Gold faces increasing selling interest and navigates the area of three-month lows near the $4,300 mark per troy ounce on Friday. The precious metal’s decline comes as traders assess the stronger-than-expected NFP, while the bid bias in the Greenback and higher US Treasury yields also collaborate with the retracement.

Cardano hits five-year low even as Hoskinson clarifies "break" isn't an exit

Cardano (ADA) price is down 10% at press time on Friday, extending losses over 30% so far this week amid Charles Hoskinson's clarification that "break" isn't an exit.

Week ahead – Fed countdown begins amid US inflation data and geopolitical risks

Fed Chair Warsh’s first meeting approaches as key US inflation data could reshape expectations. Oil prices remain elevated as US-Iran talks continue; tariffs also return to the spotlight. ECB is expected to hike; will it be a one-off move or is July live?

The US economy defies the rules: 100 days into the Oil shock and the recession signal is still missing

More than three months after the start of the Iran war and the resulting disruption to global energy markets, the US economy continues to display remarkable resilience. The conflict has triggered a sharp rise in Oil prices, reignited inflationary pressures and fueled widespread concerns about a potential economic slowdown.