GBP/USD Analysis: Minor corrective rally on cards?
- Open interest in the cheap out-of-the-money calls spiked on Friday.
- Investors hedging against a potential corrective rally in GBP/USD.
The GBP/USD for the fourth straight day on Friday, hitting the psychological support of 1.40 for the first time since April 6.
Daily chart
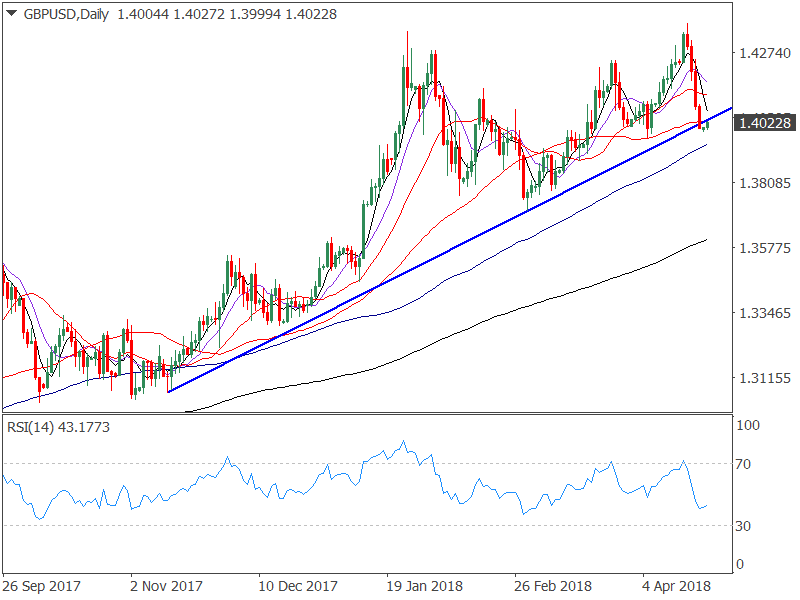
The currency pair closed below the ascending trendline, confirming a short-term bullish-to-bearish trend change. The 5, 10 and 21-day moving average (MA) is biased bearish. Further, the relative strength index (RSI) has dropped below 50.00 - into bearish territory. However, a bullish RSI divergence is seen on the 1-hour chart and the 4-hour RSI shows oversold conditions.
Meanwhile, the option market details published by the CME show a big jump in the open interest (OI) or open positions in the cheap out-of-the-money (OTM) GBP calls (buy GBP).
GBP/USD GBUK8 Open Interest Change: Current (Apr 20 - Prelim) vs Apr 19
| CALL SUMMARY | |||||
| TOTAL | ITM | OTM | |||
| OI | CHG | OI | CHG | OI | CHG |
| 22,605 | 1,069 | 3,446 | -2 | 19,159 | 1,071 |
| PUT SUMMARY | |||||
| TOTAL | ITM | OTM | |||
| OI | CHG | OI | CHG | OI | CHG |
| 23,401 | -497 | 4,551 | -30 | 18,850 | -467 |
The open interest in the OTM calls jumped by 1,071 contracts on Friday. Meanwhile, the open interest in the put options (sell GBP) fell by 497 contracts.
Clearly, the investors are positioned for a minor corrective rally in the GBP/USD pair. The options data adds credence to the bullish price-RSI divergence on the 1-hour chart and the oversold conditions shown by the 4-hour RSI.
The immediate upside will likely be capped around 1.41, while on the downside, acceptance below 1.3965 (April 5 low) could prove costly for the GBP bulls.
Author

Omkar Godbole
FXStreet Contributor
Omkar Godbole, editor and analyst, joined FXStreet after four years as a research analyst at several Indian brokerage companies.


