The broad-based sell-off in the USD post-Fed pushed the GBP/USD pair to a four-day high of 1.3449 levels. However, the options activity indicates increased demand for downside bets on the GBP. It indicates investors could be worried the post-Fed gains could be transient.  

GBP/USD GBUF8 Open Interest Change: Current (Dec 13 - Prelim) vs. Dec 12 (Source CME)

Call Summary
Total ITM OTM
OI Chg OI Chg OI Chg
29,168 -49 10,545 9 18,623 -58


Put Summary
Total ITM OTM
OI Chg OI Chg OI Chg
28,944 219 1,835 13 27,109 206

  • Despite the bullish move, the open interest (OI) in the GBP puts increased by 219 contracts yesterday. The out of the money puts added 206 contracts.
  • Meanwhile, the OI in the GBP calls dropped by 49 contracts.

Clearly, investors are seeking downside protection, which makes sense given the Brexit uncertainty. After all, the British government suffered defeat in a key vote on Brexit bill yesterday. Also, there is a feeling in the market that the Bank of England (BOE) is stuck between the rock and the hard place.

While inflation continues to rise (rose to 6-year high in November), the BOE would still have a hard time tightening the screws courtesy of the economic uncertainty surrounding Brexit.

That said, the price chart analysis still favors the bulls.

GBP/USD Monthly chart

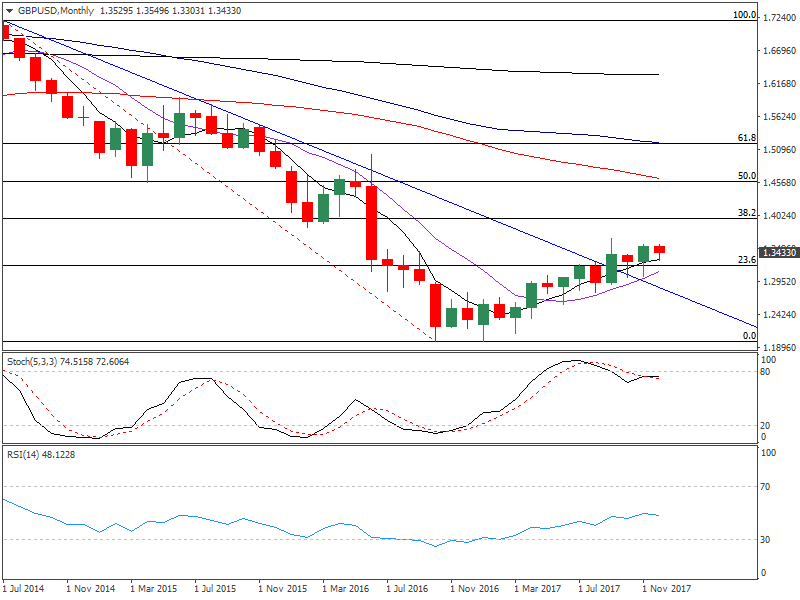
  • The above chart shows the doors are open for a rally to 1.3954 (38.2% Fib R). Last month's bullish hammer candle confirmed the bullish view. Also, the current month candle has witnessed a rebound from the ascending 5-MA.

View

  • The rise in the OI in the GBP Puts does not necessarily mean the yesterday's rally in GBP/USD is a bull trap. However, it does indicate the investors are cautiously bullish, i.e. seeking downside protection against the long spot positions.
  • A break above 1.3550 would revive the bullish move and shall open doors for a rally to 1.3835 (Feb. 2016 low).
  • On a larger scheme of things, only a sustained break below 1.30 would abort the bullish view.

Information on these pages contains forward-looking statements that involve risks and uncertainties. Markets and instruments profiled on this page are for informational purposes only and should not in any way come across as a recommendation to buy or sell in these assets. You should do your own thorough research before making any investment decisions. FXStreet does not in any way guarantee that this information is free from mistakes, errors, or material misstatements. It also does not guarantee that this information is of a timely nature. Investing in Open Markets involves a great deal of risk, including the loss of all or a portion of your investment, as well as emotional distress. All risks, losses and costs associated with investing, including total loss of principal, are your responsibility. The views and opinions expressed in this article are those of the authors and do not necessarily reflect the official policy or position of FXStreet nor its advertisers. The author will not be held responsible for information that is found at the end of links posted on this page.

If not otherwise explicitly mentioned in the body of the article, at the time of writing, the author has no position in any stock mentioned in this article and no business relationship with any company mentioned. The author has not received compensation for writing this article, other than from FXStreet.

FXStreet and the author do not provide personalized recommendations. The author makes no representations as to the accuracy, completeness, or suitability of this information. FXStreet and the author will not be liable for any errors, omissions or any losses, injuries or damages arising from this information and its display or use. Errors and omissions excepted.

The author and FXStreet are not registered investment advisors and nothing in this article is intended to be investment advice.

Recommended Content


Recommended Content

Editors’ Picks

AUD/USD failed just ahead of the 200-day SMA

AUD/USD failed just ahead of the 200-day SMA

Finally, AUD/USD managed to break above the 0.6500 barrier on Wednesday, extending the weekly recovery, although its advance faltered just ahead of the 0.6530 region, where the key 200-day SMA sits.

AUD/USD News

EUR/USD met some decent resistance above 1.0700

EUR/USD met some decent resistance above 1.0700

EUR/USD remained unable to gather extra upside traction and surpass the 1.0700 hurdle in a convincing fashion on Wednesday, instead giving away part of the weekly gains against the backdrop of a decent bounce in the Dollar.

EUR/USD News

Gold keeps consolidating ahead of US first-tier figures

Gold keeps consolidating ahead of US first-tier figures

Gold finds it difficult to stage a rebound midweek following Monday's sharp decline but manages to hold above $2,300. The benchmark 10-year US Treasury bond yield stays in the green above 4.6% after US data, not allowing the pair to turn north.

Gold News

Bitcoin price could be primed for correction as bearish activity grows near $66K area

Bitcoin price could be primed for correction as bearish activity grows near $66K area

Bitcoin (BTC) price managed to maintain a northbound trajectory after the April 20 halving, despite bold assertions by analysts that the event would be a “sell the news” situation. However, after four days of strength, the tables could be turning as a dark cloud now hovers above BTC price.

Read more

Bank of Japan's predicament: The BOJ is trapped

Bank of Japan's predicament: The BOJ is trapped

In this special edition of TradeGATEHub Live Trading, we're joined by guest speaker Tavi @TaviCosta, who shares his insights on the Bank of Japan's current predicament, stating, 'The BOJ is Trapped.' 

Read more

Majors

Cryptocurrencies

Signatures