GBP/USD Analysis: Boris takes the seat, Pound the hit

GBP/USD Current Price: 1.2440
- UK CBI’s industrial trend survey shows biggest slowdown since the financial crisis.
- Boris Johnson won the Tory Leadership’s contest, risk of a hard-Brexit increased.
- GBP/USD falters near a critical resistance, closes in the red for a third consecutive day.
The GBP/USD pair remained depressed this Tuesday, falling intraday to 12417, a fresh weekly low. The Pound was initially weighed by the CBI’s industrial trends survey, which showed that business optimism had fallen sharply in July, down to -34 from -15 in June, indicating at the local industry is facing its biggest slowdown since the financial crisis, amid mounting fears of a tough Brexit. Adding pressure on the Pound, Anne Milton has resigned as skills ministers, attributing her decision to concerns about the prospect of a no-deal exit. As widely anticipated, Boris Johnson won the Conservative Party’s leadership, roughly getting double the votes of Jeremy Hunt. UK Finance Minister, Philip Hammond, has said he would resign if Johnson becomes the PM, but so far there is no news in that front. Anyway, given that Mr. Johnson said he would exit the EU with or without a deal by October 31, more resignation are expected alongside Sterling slides. The UK macroeconomic calendar only includes June BBA Mortgage Approvals this Wednesday.
GBP/USD short-term technical outlook
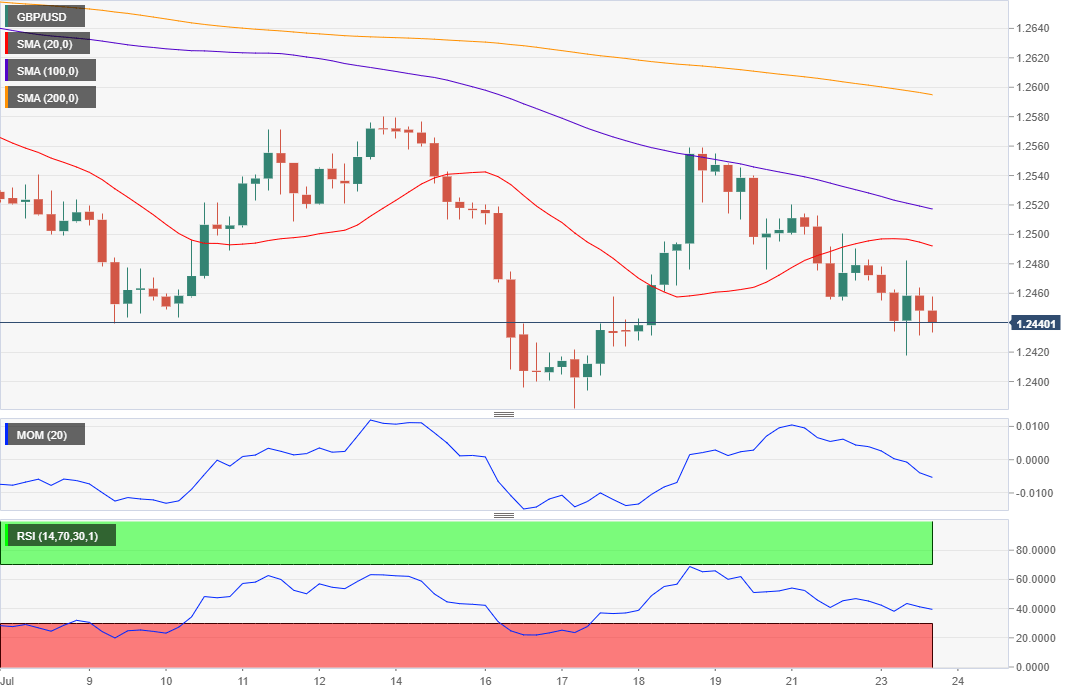
The GBP/USD pair posted a modest intraday advance around the time of the announcement of the leadership contest’s outcome, but the rally was rejected by sellers aligned around the daily descendant trend line coming from June’s high. The pair posted a lower low and a lower high for a second consecutive day, which maintains the risk skewed to the downside. In the 4 hours chart, the 20 SMA has lost its strength upward, now near the mentioned trend line, providing dynamic resistance at around 1.2485. The Momentum indicator in the mentioned chart has bounced from oversold readings but remains in negative territory, while the RSI indicator has already resumed its decline, currently at 39, all of which favors a downward extension should 1.2420, the immediate support, gives up.
Support levels: 1.2420 1.2375 1.2320
Resistance levels: 1.2485 1.2510 1.2550
Author

Valeria Bednarik
FXStreet
Valeria Bednarik was born and lives in Buenos Aires, Argentina. Her passion for math and numbers pushed her into studying economics in her younger years.