|

GBP/USD 5 levels to watch as the Brexit-chaos continues — Confluence Detector

GBP/USD volatility is high. Cable shot up to nearly 1.34 as Parliament rejected a no-deal Brexit but then cooled down all the way to 1.3250. What's next? Here are five levels to watch, starting from three support lines and moving to two resistance lines.

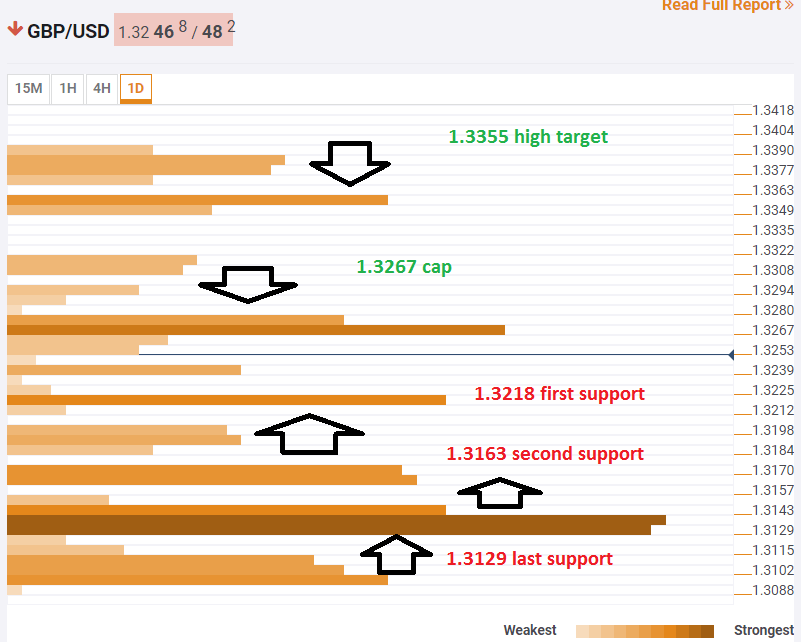
The Technical Confluences Indicator shows that immediate support awaits at 1.3218 which is the convergence of the Fibonacci 23.6% one-month and the Simple Moving Average 100-15m.

The second support zone is at 1.3163 which is the confluence of the Fibonacci 61.8% one-week, the SMA 10-4h, the SMA 10-1d, the SMA 200-15m, and the SMA 50-1h.

The third and most substantial support line is at 1.3129 which is a cluster consisting of the Fibonacci 38.2% one-month, the SMA 5-1d, the Pivot Point one-day Support 1, the SMA 100-4h, and the Bollinger Band 1h-Lower.

Looking up, initial resistance awaits at 1.3267 which is the meeting point of the SMA 5-1h, the Fibonacci 38.2% one-day, last week's high, and the SMA 50-15m. 

The second cap is at 1.3355 where the previous month's high meets the Bollinger Band 1h-Upper.

This is how it looks on the tool:

GBP USD technical analysis confluence March 14 2019

Confluence Detector

The Confluence Detector finds exciting opportunities using Technical Confluences. The TC is a tool to locate and point out those price levels where there is a congestion of indicators, moving averages, Fibonacci levels, Pivot Points, etc. Knowing where these congestion points are located is very useful for the trader, and can be used as a basis for different strategies.

This tool assigns a certain amount of “weight” to each indicator, and this “weight” can influence adjacents price levels. This means that one price level without any indicator or moving average but under the influence of two “strongly weighted” levels accumulate more resistance than their neighbors. In these cases, the tool signals resistance in apparently empty areas.

Learn more about Technical Confluence

Author

Yohay Elam

Yohay Elam

FXStreet

Yohay is in Forex since 2008 when he founded Forex Crunch, a blog crafted in his free time that turned into a fully-fledged currency website later sold to Finixio.

More from Yohay Elam
Share:

Editor's Picks

EUR/USD risks a deeper drop below 1.1750

EUR/USD keeps its vacillating mood in place as the the NA session drwas to a close on Tuesday, hovering below the 1.1800 hurdle amid acceptable gains in the US Dollar. In the meantime, market participants and the FX galaxy are expected to closely follow President Trump’s SOTU speech around 2AM GMT.
 

GBP/USD regains 1.3500 and above

GBP/USD extends its advance for the third day in a row on Tuesday, this time retesting the area beyond the 1.3500 hurdle. Cable’s uptick comes despite decent gains in the Greenback and the dovish message from the BoE’s Bailey at the UK Parliament.

Gold appears offered around $5,150

Gold is giving back a good portion of the recent multi-day rally, receding to the $5,150 zone per troy ounce amid the decent bounce in the US Dollar and mixed US Treasuty yields. In the meantime, markets’ attention remain on upcoming comments from Fed speakers.

Ripple’s DeFi shift in focus: Navigating XRPL EVM sidechain growth, XRPFi migration and liquidity
Ripple (XRP) has continued to trade under pressure, extending its decline by approximately 63% from the record high of $3.66 in July. The remittance token is trading above support at $1.35, while its upside appears limited by key supply zones, starting with $1.40, at the time of writing on Tuesday.
The Citrini report: How a debatable AI narrative can shake Wall Street

That AI-related headline alone was enough to rattle investors.US stocks slid sharply on Monday after a widely circulated Citrini Research memo outlined a hypothetical “2028 Global Intelligence Crisis”, warning that rapid AI adoption could push US unemployment into double digits as early as by mid-2028.

XRP pressured by weak ETF flows and declining retail interest

Ripple (XRP) is edging lower, trading above its intraday low of $1.32 at the time of writing on Tuesday. The decline from its weekly opening of $1.39 reflects heightened volatility in the broader cryptocurrency market, accentuated by tariff-triggered uncertainty.