GBP/USD 1H Chart: Channel Down
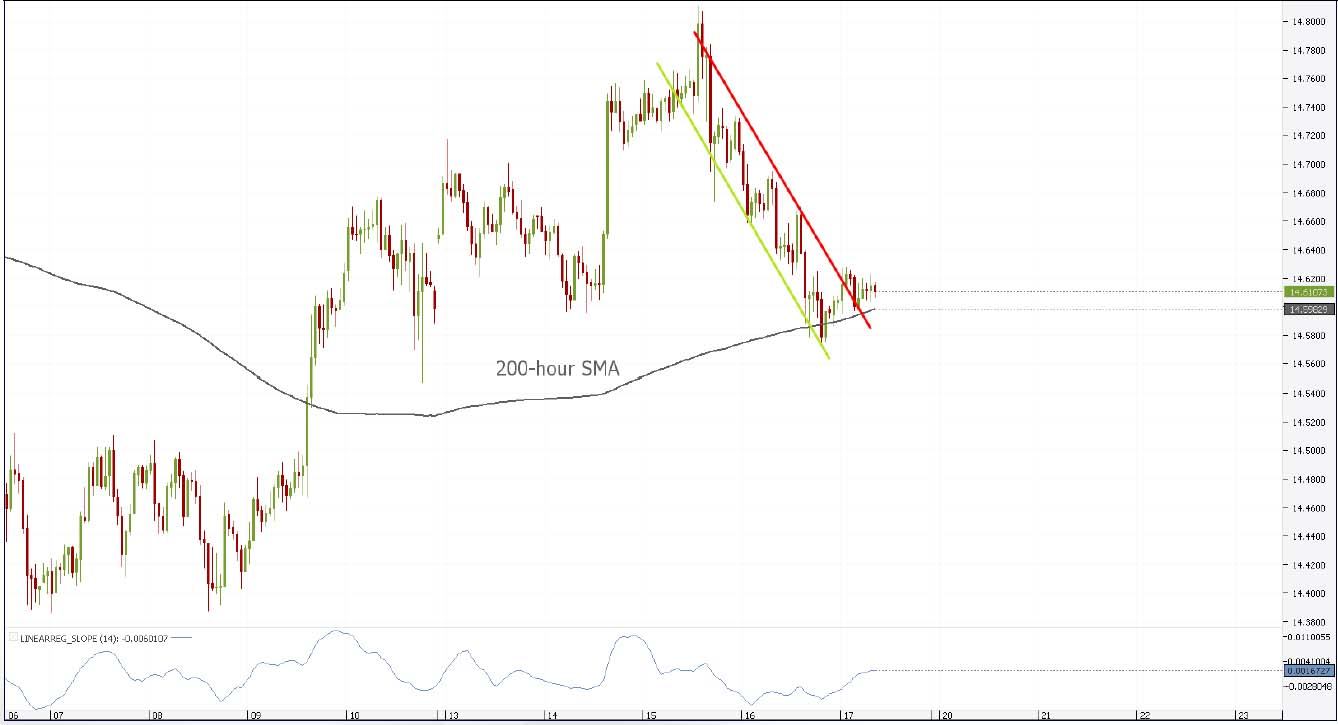
HKD/JPY 1H Chart: Channel Down
Comment: Following attacks at almost yearly highs of 15.24 in December 2016 and January, HKD/JPY put an end to the uptrend with a double top on the daily chart and went on to extend a slide. The pair was attempting to reverse from the bearish trend, but unsuccessfully, as channels were broken and a new—bearish one was recently established on the hourly chart. The pair has, however, just broken the upper boundary of the channel, which means that a rally – at least a short-term one – should come next. It appears that the pair has already undergone a retracement of the broken trend-line at 14.60 and the current weigh on the 200-hour SMA will be followed by a soar towards 14.63 and then 14.65, while ground lies at 14.60 and lower-14.59.
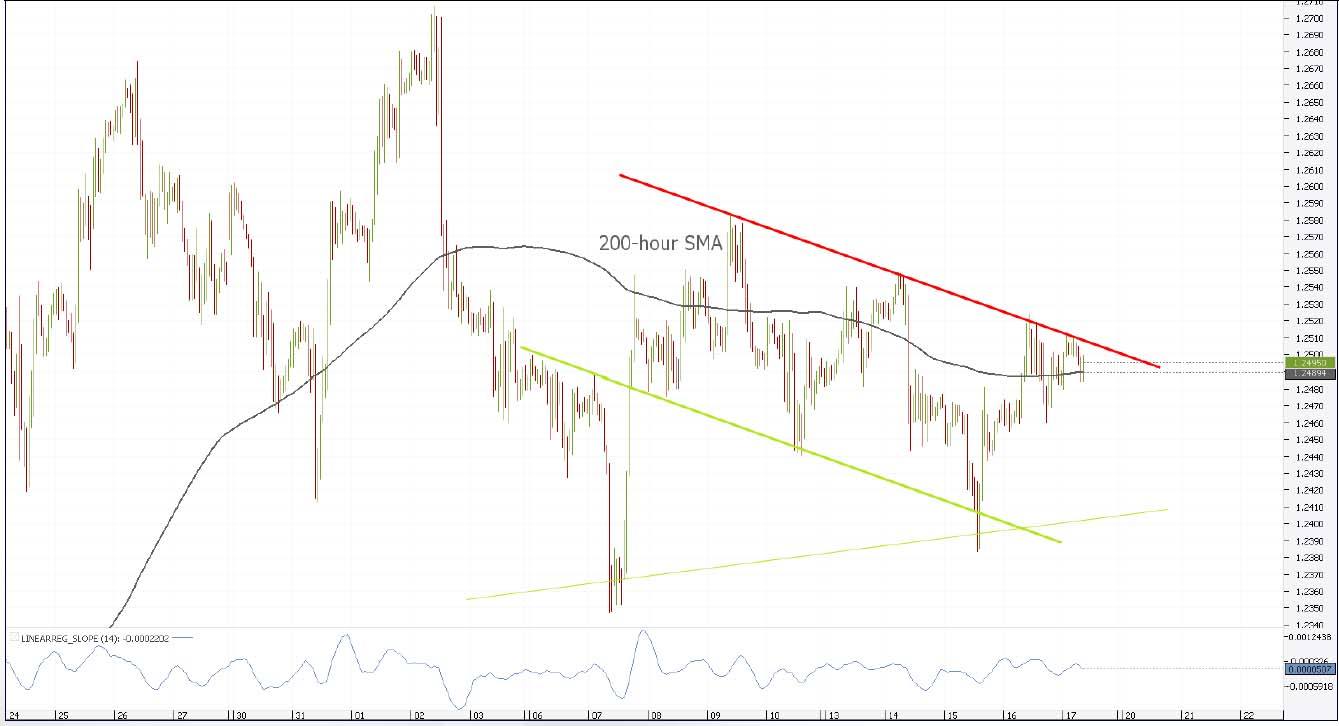
GBP/USD 1H Chart: Channel Down
Comment: A set of bearish patterns are leading GBP/USD to the downside on several different time-frames. The pair has been following an indistinctive channel down pattern on the daily chart, sketching some additional bearish formations on other time-frames. An overlap of a channel down and symmetrical triangle tells us unanimously that the downtrend should extend in the short, medium and long-term. The pair has just tested the upper boundary of both patterns at 1.2510 and will be making its way towards 1.2405, the bottom boundary of the triangle, and potentially then to 1.2372, the channel trend-line, in case the latter takes over. A strong support cluster at 1.2472/71 will steal some momentum from the motion.
Author

Dukascopy Bank Team
Dukascopy Bank SA
Dukascopy Bank stands as an innovative Swiss online banking institution, with its headquarters situated in Geneva, Switzerland.


