GBP/JPY: The bull getting stronger

GBP/JPY, after being bearish for several days, seems to have found its support. The price has been heading towards the North for the last five trading days. The last daily candle of the year 2019 came out as a doji candle. The last swing high shows that the price still has some space to travel towards the North. Major intraday charts look good for the bull as well. Thus, the buyers may look for buying opportunities on the pullback and push the price towards the upside to the last swing high.
Chart 1 GBP/JPY Daily Chart
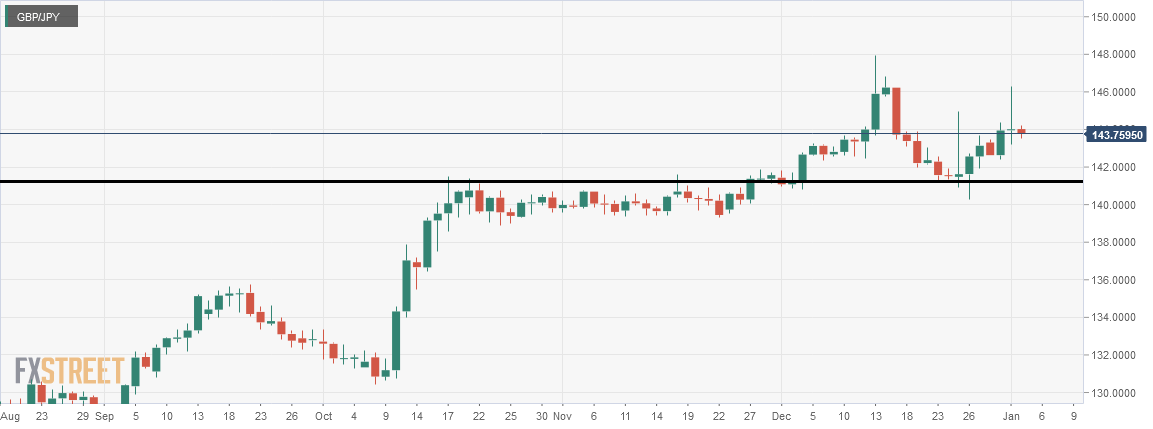
The chart shows that the price has found its support at the level of 141.2045. The price consolidated around the level and then made a bullish breakout. Since the price after making a bullish reversal at the same level heading towards the North, the buyers may want to look for buying opportunities up to the level of 148.0000. The last daily candle had a rejection at the level of 146.0000. Thus, the daily traders shall wait for the price to make a breakout at the level of 146.0000 to go long on the pair.
Chart 2 GBP/JPY H4 Chart
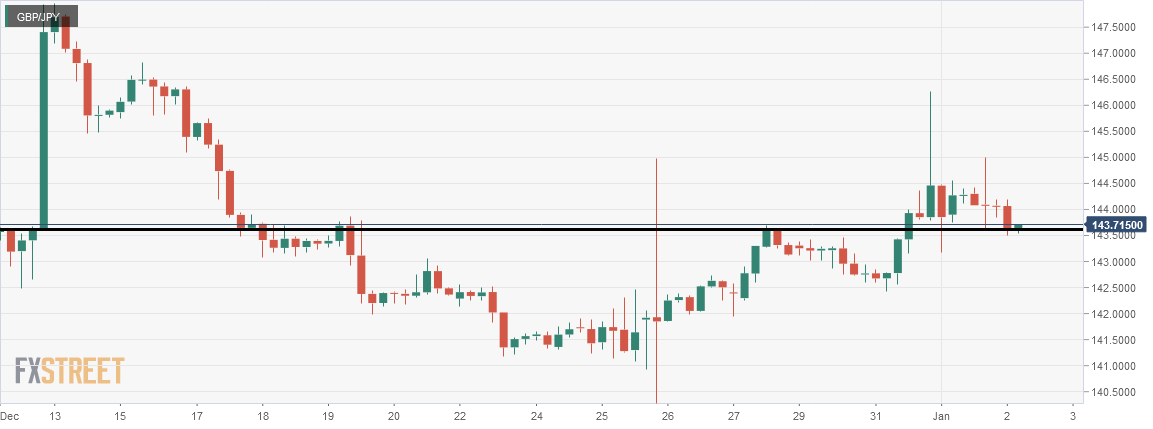
The H4 chart shows that the price has been on consolidation 143.5000. The last candle came out as a bearish marubozu candle. However, the level is a flipped level of support. It may hold the price and push the price towards the North. If the current candle comes out as a bullish engulfing candle, the buyers may go long on the pair. The price may find its next resistance at the level of 146.0000 on the H4 chart. On the other hand, if the price makes a breakout at the level of support, it may find its next support at the level of 142.5000.
Chart 3 GBP/JPY H1 Chart
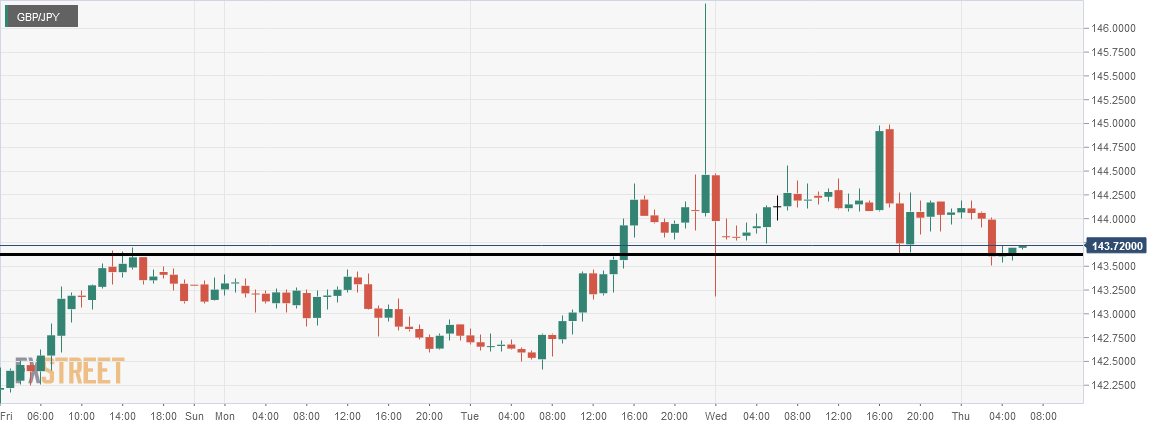
The H1 chart shows that the price is roaming around the level of 143.6000. The price had a bounce earlier. If the level holds the price and makes a breakout at the neckline, it would be considered as a double bottom. A double bottom and a breakout at the neckline shall attract the buyers to push the price towards the upside. As far as the H1 chart is concerned, the price may find its next resistance at the level of 145.0000.
The H4 and the daily chart look suitable for the buyers. The H1 chart looks even better. If today’s candle comes out as a bullish candle, the buyers may dominate on the pair for the next few days.
Author

EagleFX Team
EagleFX
EagleFX Team is an international group of market analysts with skills in fundamental and technical analysis, applying several methods to assess the state and likelihood of price movements on Forex, Commodities, Indices, Metals and


