GBP/JPY Elliott Wave technical analysis [Video]
![GBP/JPY Elliott Wave technical analysis [Video]](https://editorial.fxstreet.com/images/Markets/Currencies/Crosses/GBPJPY/iStock-1151541926_XtraLarge.jpg)
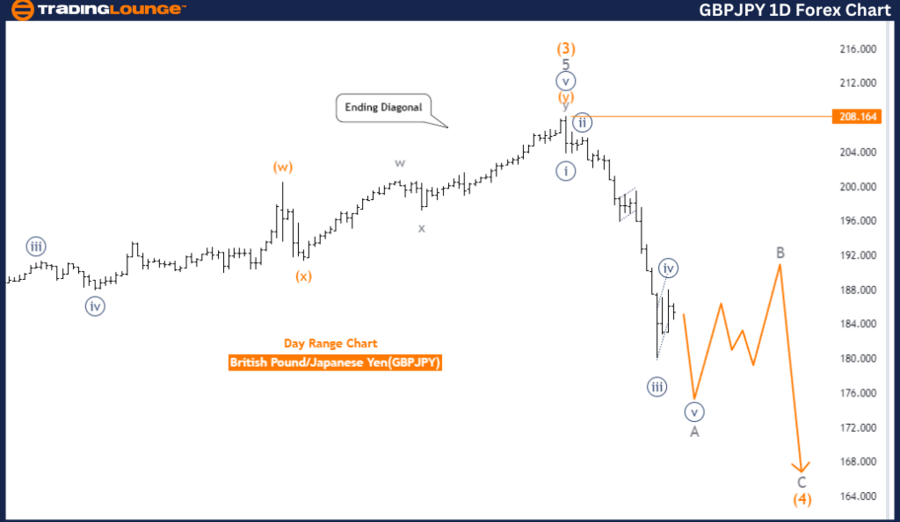
GBPJPY Elliott Wave Analysis Trading Lounge Day Chart.
British Pound/Japanese Yen (GBPJPY) Day Chart.
GBP/JPY Elliott Wave technical analysis
Function: Counter Trend.
Mode: Corrective.
Structure: Gray wave A.
Position: Orange wave 4.
Direction next higher degrees: Gray wave B.
Details: Orange wave 3 looking completed, now wave A of orange wave 4 is in play. Wave Cancel invalid level: 208.164.
The GBPJPY Elliott Wave Analysis on the daily chart reveals a market in a counter trend function. This trend is characterized as corrective, which typically indicates a temporary pause or reversal in the prevailing market direction before the original trend resumes. The wave structure currently under analysis is gray wave A, a significant component of the broader corrective phase.
The market's position is at orange wave 4, suggesting that the corrective process is unfolding within this specific wave. The analysis highlights that the next higher degree direction is gray wave B. This implies that after the completion of gray wave A, the market is expected to transition into gray wave B, which often represents a partial retracement or continuation of the previous trend in a more measured manner.
It is noted that orange wave 3 appears to be completed. This completion is an essential milestone as it indicates that the market has moved through the impulsive phase of orange wave 3 and is now transitioning into the corrective phase of wave A within orange wave 4. The progression into wave A of orange wave 4 signals a shift in market sentiment and typically involves a corrective retracement of the previous impulsive movement.
The wave cancellation invalid level is specified at 208.164. This level is crucial as it serves as a validation point for the current wave count. If the GBPJPY price drops below this level, it would invalidate the current wave structure, suggesting that the expected progression from orange wave 3 to orange wave 4 is not occurring as anticipated. Such an event would require a reassessment of the wave count and a new analysis of the market's direction.
In summary, the GBPJPY Elliott Wave Analysis on the daily chart indicates a counter trend function in a corrective mode. The current structure is gray wave A, with the market positioned at orange wave 4. The next higher degree direction points to gray wave B. With orange wave 3 completed, the market is now moving into wave A of orange wave 4. The wave cancellation invalid level at 208.164 is vital for maintaining the validity of the current wave structure.
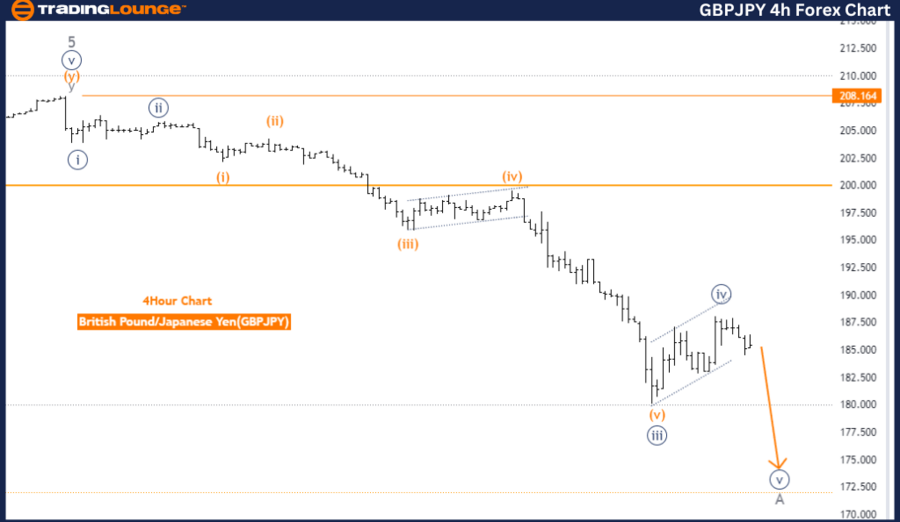
GBPJPY Elliott Wave Analysis Trading Lounge 4 Hour Chart
British Pound/Japanese Yen (GBPJPY) 4 Hour Chart
GBP/JPY Elliott Wave technical analysis
Function: Counter Trend.
Mode: Impulsive.
Structure: Navy blue wave 5.
Position: Gray wave A.
Direction next higher degrees: Gray wave B.
Details: Navy blue wave 4 looking completed, now wave 5 is in play. Wave Cancel invalid level: 208.164.
The GBPJPY Elliott Wave Analysis on the 4-hour chart indicates that the market is in a counter trend function. This trend is described as impulsive, suggesting strong directional movements. The current wave structure under analysis is navy blue wave 5, signifying a continuation of the trend within this wave. The market's current position is at gray wave A, which marks the beginning of a new phase within the larger wave structure.
The analysis suggests that the next higher degree direction will be gray wave B. This implies that after the completion of gray wave A, the market is expected to move into gray wave B. Typically, gray wave B represents a corrective phase that follows an impulsive wave, often involving a retracement of the preceding movement.
It is noted that navy blue wave 4 appears to be completed. This completion is a key point in the wave analysis as it indicates that the market has moved through the corrective phase of wave 4 and is now advancing into the impulsive phase of navy blue wave 5. The progression into navy blue wave 5 is characterized by a strong trend movement, continuing in the direction established by the prior waves.
The wave cancellation invalid level is specified at 208.164. This level is critical as it acts as a threshold for the validity of the current wave count. Should the GBPJPY price fall below this level, the current wave structure would be invalidated, suggesting that the expected progression from navy blue wave 4 to navy blue wave 5 is not occurring as projected. This would necessitate a reevaluation of the wave count and a reassessment of the market's direction.
In summary, the GBPJPY Elliott Wave Analysis on the 4-hour chart shows the market in a counter trend mode, with an impulsive structure. The current position is gray wave A, with the direction pointing towards gray wave B. With navy blue wave 4 completed, the market is now moving into navy blue wave 5. The wave cancellation invalid level at 208.164 is crucial for maintaining the current wave structure's validity.
Technical analyst: Malik Awais.
GBP/JPY Elliott Wave technical analysis [Video]
Author

Peter Mathers
TradingLounge
Peter Mathers started actively trading in 1982. He began his career at Hoei and Shoin, a Japanese futures trading company.


