GBP/CHF to make an upside breakout for the trend continuation

GBPCHF has been bullish on the daily chart for the last six weeks. The price has been heading towards the North by making breakouts towards the upside. The pair after finding support made a breakout at a down-trending trend line; the price had a consolidation; confirmed the trend line breakout and came out from the horizontal range. Since then the price has been bullish with good buying pressure.
Let us have a look at the GBP/CHF Daily chart
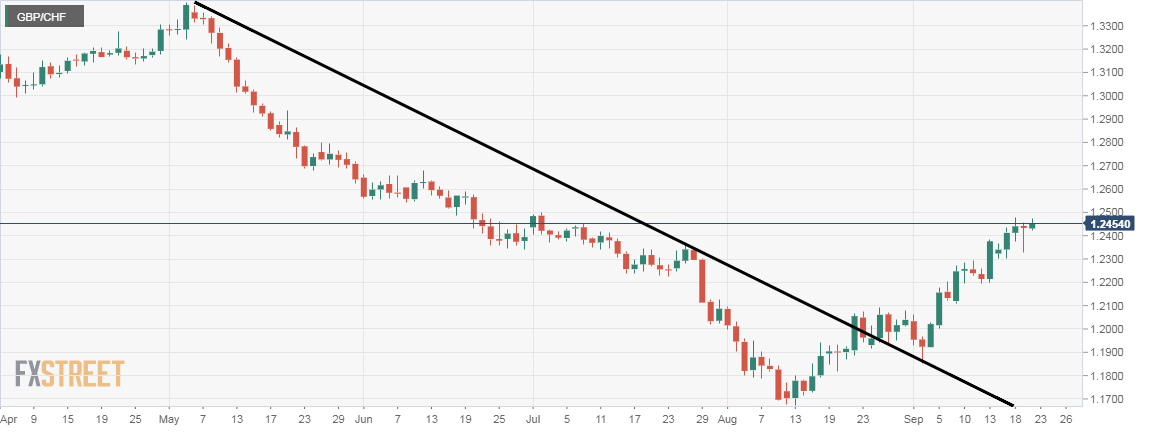
Chart 1 GBP/CHF Daily Chart
The chart shows that the price was down-trending before the trend line got breached. The price after making the breakout at the trend line had a long consolidation. A bullish Pin Bar followed by a bullish Engulfing Candle set a strong bullish tone, and the pair came out from the range by making a breakout at the horizontal resistance of the consolidation zone.
The price has found another horizontal support level where it had a strong bounce yesterday.
Let us have a look at the chart below
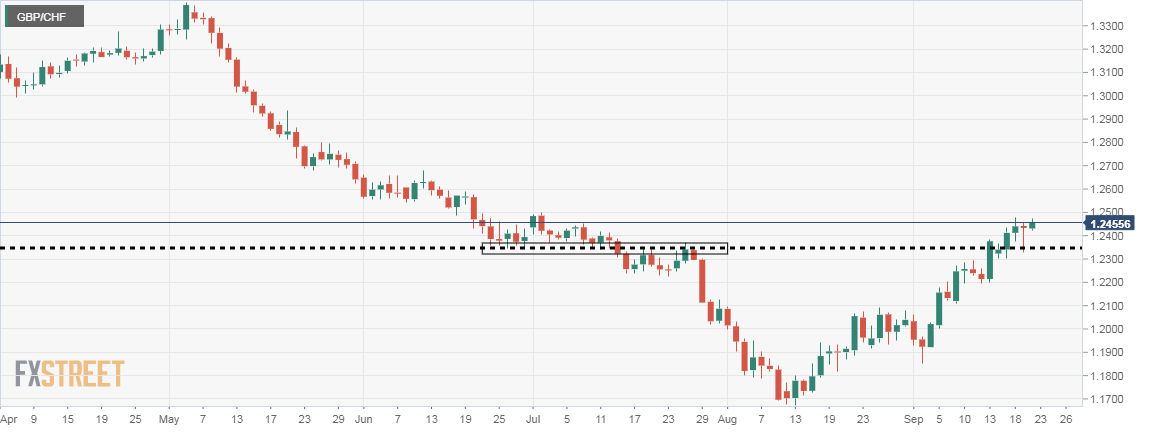
Chart 2 GBP/CHF Daily Chart
The chart explicitly shows that the level of 1.2350 is a significant level where the price had reacted heavily earlier. The level got breached, and yesterday's daily price had a strong bounce which eventually made the daily candle be a bullish Pin Bar. If today’s intraday price makes a breakout at the day before yesterday’s highest high, the price may head towards the North with more buying pressure. Today’s intraday price action has been bullish. Thus, there is a strong possibility that the price makes an upside breakout.
Let us now have a look at the H4 GBP/CHF chart

Chart 3 GBP/CHF H4 Chart
The chart shows that the price had a rejection from the level of 2.3480 and had a pullback. The level of 1.2350 has been working as the level of support here. After producing an H4 bullish engulfing candle at the support level, the price has headed towards the North, and it is right at the resistance level now. If the price continues to push towards the North and makes a breakout, then both the H4 and daily buyers are going to get themselves engaged in buying the pair.
Here is another equation we may count. If the price does not make an H4 breakout at the resistance level but comes towards the South, it may attract the H4 sellers to get them engaged in selling since it would be an H4 Double Top’s resistance.
Equations favor the buyer more here. Let us now wait and see which way the next breakout takes place.
Author

EagleFX Team
EagleFX
EagleFX Team is an international group of market analysts with skills in fundamental and technical analysis, applying several methods to assess the state and likelihood of price movements on Forex, Commodities, Indices, Metals and


