|

GBP/CAD Elliott Wave: Buyers step in at the equal legs area
In this article, we’ll look at the price action of the GBP/CAD and the potential near-term outlook. As our members know, the pair completed a three-wave pullback into the Equal Legs area. Buyers stepped in and triggered a decent rally.

Let’s examine the Elliott Wave structure and the key levels to watch for the next move in GBP/CAD.

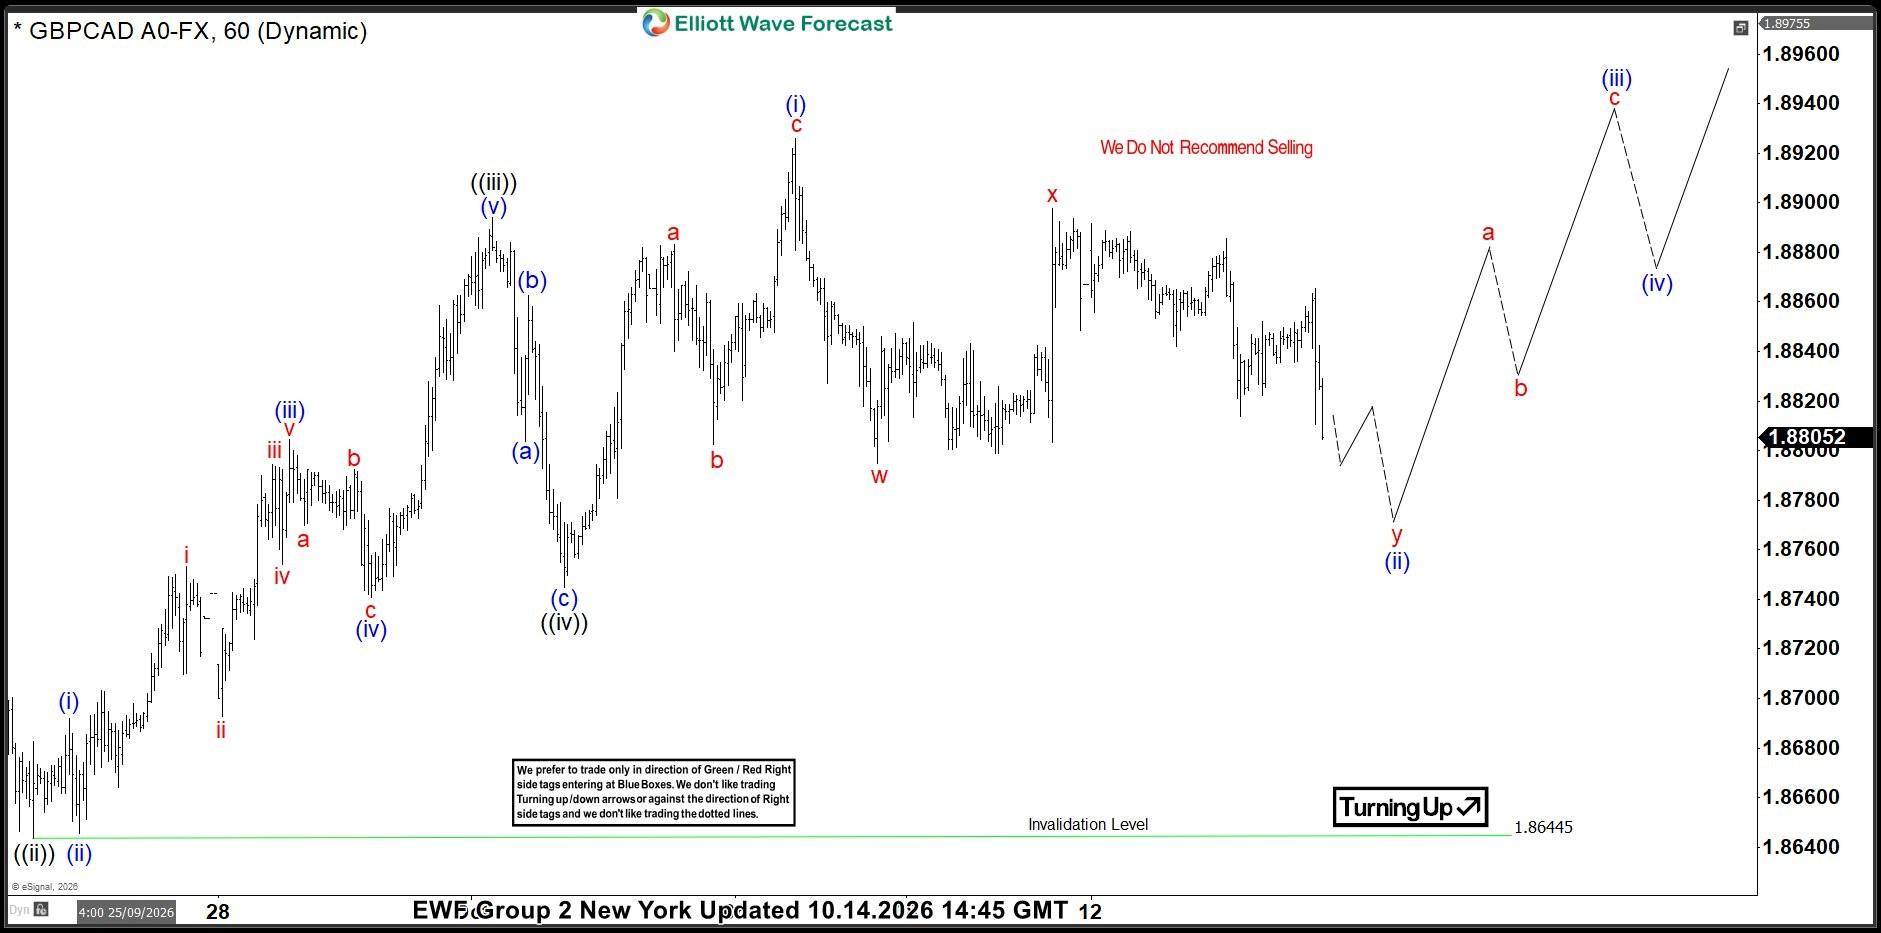
GBP/CAD Elliott Wave one-hour chart 10.14.2026

GBP/CAD had been forming a three-wave correction. The price structure suggested that the pullback was incomplete, with another leg down expected to complete the pattern. As our members know, we use the Equal Legs zone to identify the buyers’ area where a correction will complete. We calculate this zone using the Fibonacci Extension tool, projecting the 1.0–1.236 extension of wave W red relative to wave X red.

In this case, our Elliott Wave analysis identified a buyers’ zone around 1.8766–1.8685. We recommended that our members avoid selling , while favoring the long side from the mentioned Equal Legs area.
GBPCAD

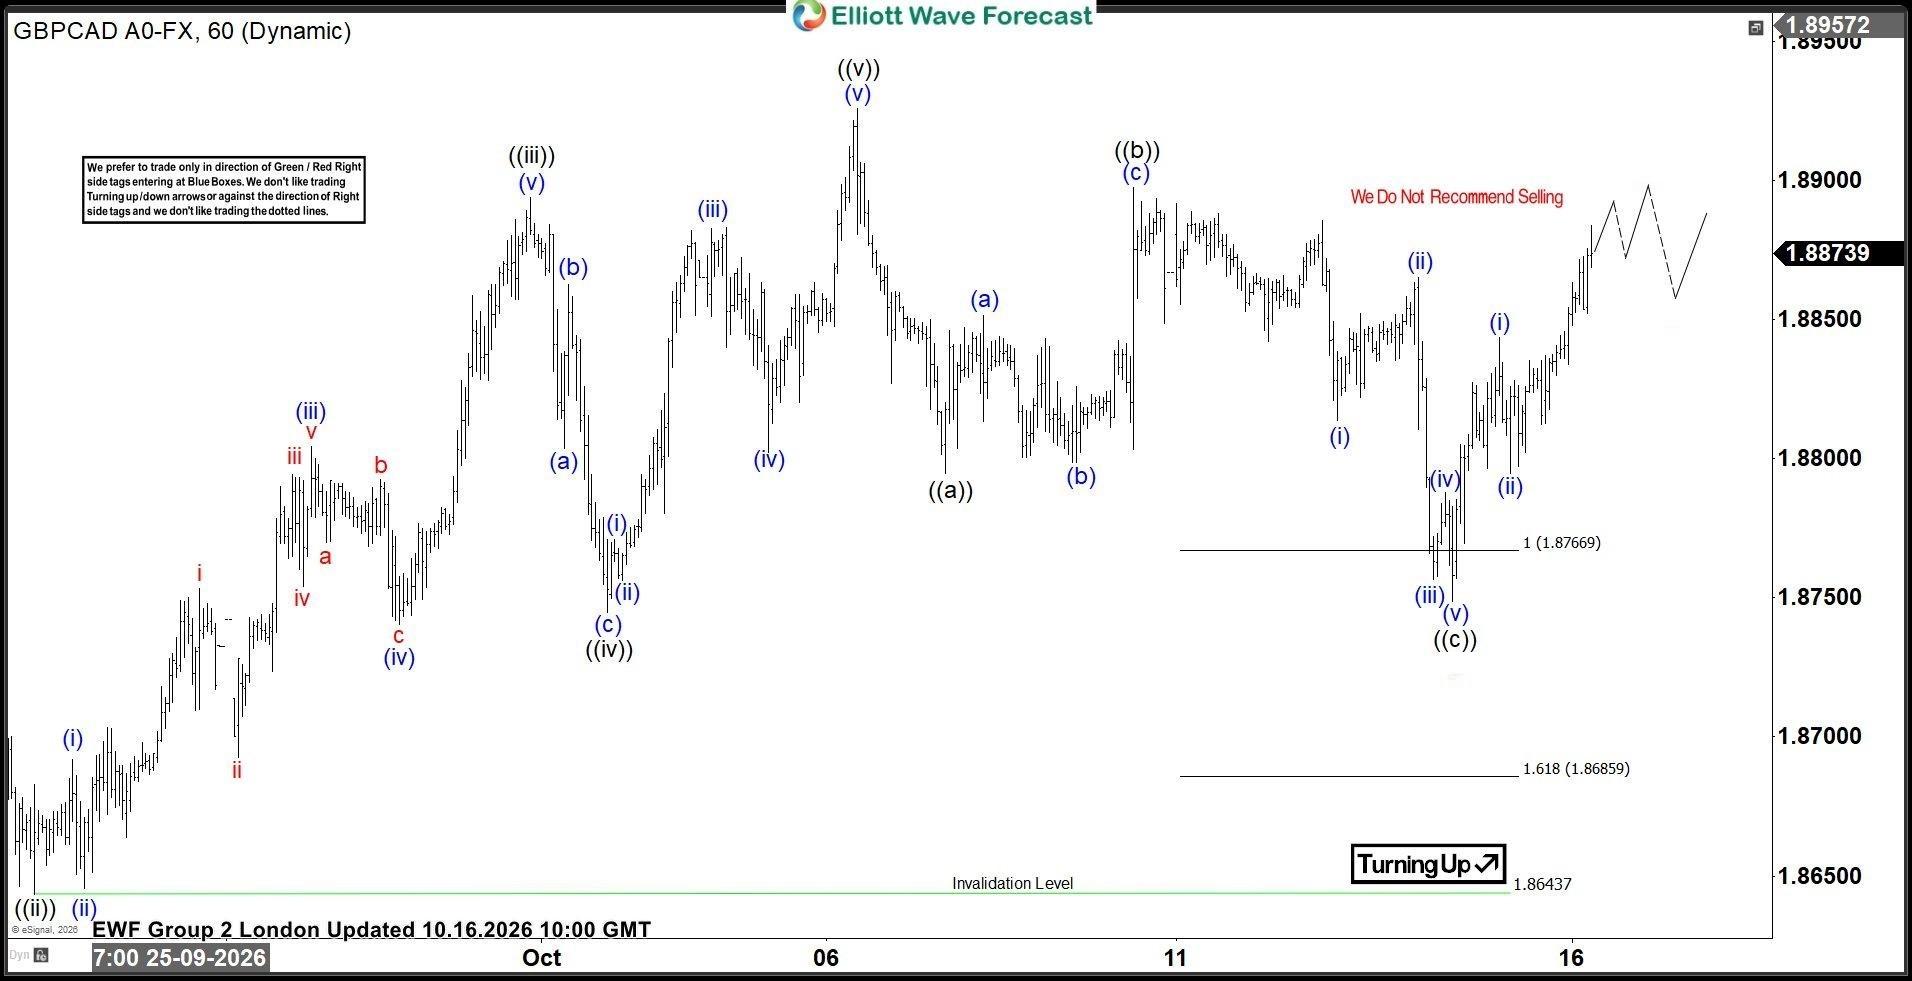
GBP/CAD Elliott Wave one-hour chart 10.14.2026

GBP/CAD reached the Equal Legs zone at 1.8766–1.8685 and found buyers as expected. The pair delivered a solid reaction from the buying zone, with the corrective cycle completing at the 1.8749. low and triggering a bounce.
GBPCAD

Author

Elliott Wave Forecast Team

Elliott Wave Forecast Team

ElliottWave-Forecast.com

More from Elliott Wave Forecast Team
Share:

Editor's Picks

AUD/USD rises to 0.6950 as USD slips on Fed's Warsh

AUD/USD regains traction and extends the bounce toward 0.6950 in the Asian session on Friday. Fed Chair Warsh's comments reinforce the selling pressure on the US Dollar, allowing the pair to stretch higher. Warsh said that he remains committed to delivering price stability without giving away anything on future interest rate path.

USD/JPY falls in symc with USD, gives up 158.00 after Warsh's speech

USD/JPY has come under fresh selling pressure and gives up 158.00 in the Asian session on Friday amid the emergence of fresh US Dollar selling. Fed Chair Warsh's non-committal commentary on the future tightening path, weighs on the US Dollar and the pair.

Gold looks vacillating above $4,150

Gold alternates gains with losses below the key $4,200 mark per troy ounce on Friday. The yellow metal’s irresolute price action comes in response to a modest pullback in the US Dollar and a tepid recovery in US Treasury yields across the board.

Bitcoin steadies at $82,000: The five forces crushing the Uptober rally

Crypto markets have remained under pressure so far in October, with Bitcoin (BTC) sliding below $80,000 earlier this week before recovering to around $82,000 on Friday, as macroeconomic headwinds and cooling demand weigh on the market.

The Fed just got a second hot inflation number. Here's what the diesel signal is really saying
The Federal Reserve (Fed) faces a renewed inflation challenge after two consecutive reports showed price pressure intensifying across the US economy. September's Consumer Price Index (CPI) confirmed accelerating consumer inflation, while the Producer Price Index (PPI) revealed an even sharper rise in business costs. Behind both reports lies a common factor: energy prices.
Everyone's dumping Gold after hot US inflation. Here's why $4,100 could be a floor, not a cliff
Gold (XAU/USD) is recovering from a sharp sell-off triggered by hotter-than-expected United States (US) inflation data released on Wednesday. The precious metal briefly plunged toward $4,073 as investors increased their bets on further Federal Reserve (Fed) interest rate hikes before recovering as US Treasury yields and the US Dollar (USD) reversed their initial gains.
















