Gas tax reduction doesn’t help [Video]
![Gas tax reduction doesn’t help [Video]](https://editorial.fxstreet.com/images/Markets/Commodities/Energy/Gas/gas-bill-5541542_XtraLarge.jpg)
US Dollar: Sep '22 USD is Up at 104.375.
Energies: Aug '22 Crude is Down at 104.13.
Financials: The Sep '22 30 Year bond is Up 23 ticks and trading at 136.22.
Indices: The Jun '22 S&P 500 emini ES contract is 8 ticks Higher and trading at 3764.75.
Gold: The Aug'22 Gold contract is trading Down at 1834.00. Gold is 44 ticks Lower than its close.
Initial conclusion
This is not a correlated market. The dollar is Up, and Crude is Down which is normal, and the 30-year Bond is trading Higher. The Financials should always correlate with the US dollar such that if the dollar is lower, then the bonds should follow and vice-versa. The S&P is Higher, and Crude is trading Lower which is correlated. Gold is trading Lower which is correlated with the US dollar trading Up. I tend to believe that Gold has an inverse relationship with the US Dollar as when the US Dollar is down, Gold tends to rise in value and vice-versa. Think of it as a seesaw, when one is up the other should be down. I point this out to you to make you aware that when we don't have a correlated market, it means something is wrong. As traders you need to be aware of this and proceed with your eyes wide open. Asia is trading Higher with the exception of the Aussie and Singapore exchanges which are down fractionally. Currently all of Europe is trading Lower.
Possible challenges to traders today
-
Unemployment Claims are out at 8:30 AM EST. Major.
-
Current Account is out at 8:30 AM EST. Major.
-
Flash Manufacturing PMI is out at 9:45 AM EST. Major.
-
Flash Services PMI is out at 9:45 AM EST. Major.
-
Fed Chair Powell Testifies at 10 AM EST. Major.
-
Natural Gas Storage is out at 10:30 AM EST. Major.
-
Crude Oil Inventories is out at 11 AM EST. This is Major.
Treasuries
Traders, please note that we've changed the Bond instrument from the 30 year (ZB) to the 10 year (ZN). They work exactly the same.
We've elected to switch gears a bit and show correlation between the 10-year bond (ZN) and the S&P futures contract. The S&P contract is the Standard and Poor's, and the purpose is to show reverse correlation between the two instruments. Remember it's likened to a seesaw, when up goes up the other should go down and vice versa.
Yesterday the ZN made its move at around 9 AM EST. The ZN hit a High at around that time and the S&P moved Higher shortly thereafter. If you look at the charts below ZN gave a signal at around 9 AM EST and the S&P moved Higher at around the same time. Look at the charts below and you'll see a pattern for both assets. ZN hit a High at around 9 AM EST and the S&P was moving Higher shortly thereafter. These charts represent the newest version of MultiCharts and I've changed the timeframe to a 15-minute chart to display better. This represented a Shorting opportunity on the 10-year note, as a trader you could have netted about a dozen ticks per contract on this trade. Each tick is worth $15.625. Please note: the front month for the ZN is now Sep '22. The S&P contract is also Sep' 22 as well. The front months are now Sep' 22. I've changed the format to Heikin-Ashi such that it may be more apparent and visible.
Charts courtesy of MultiCharts built on an AMP platform
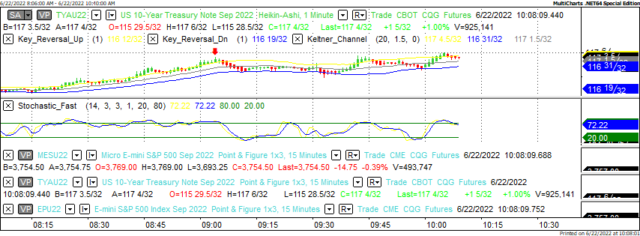
ZN - Sep 2022 - 06/22/22
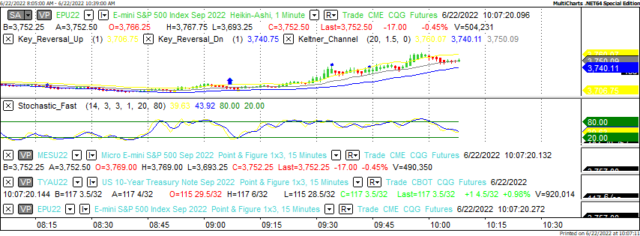
S&P - Sep 2022 - 06/22/22
Bias
Yesterday we gave the markets a Downside bias as both the USD and the Bonds were trading Higher Wednesday morning and that is usually indicative of a Downside Day. The markets didn't disappoint as the Dow dropped 47 points and the indices fell as well. Today we aren't dealing with a corelated market, and our bias is Neutral.
Could this change? Of Course. Remember anything can happen in a volatile market.
Commentary
Yesterday morning our bias was to the Downside as the indices were correlated in that direction. When the announcement came out that Biden had eliminated (or is trying to eliminate) the Federal Gas Tax for three months; we felt that the Downside bias would reverse and for awhile it did. However at the end of the day the markets did close Lower, not by much to be sure but still to the downside nonetheless. To add further confusion to the mix Fed Chair claimed that the US economy could withstand further rate hikes without a recession. Any student of the markets will tell you that whenever the Fed does that, a recession follows. Why? Let's examine it. The Fed raises rates to slow down consumer spending, when consumer spending slows down suppliers reduce prices. Reduced prices means less inflation. The problem with this is with reduced demand sales slump and when sales sump companies reduce overhead aka people. The only time a soft landing was engineered successfully was in the 1990's under the leadership of Alan Greenspan and he told everyone what he was planning on doing. It worked. Will it work now? Only time will tell....
Author

Nick Mastrandrea
Market Tea Leaves


