Further clues reveal gold’s weakness

It might have been tempting to think that the recent move lower in the U.S. Dollar Index would serve to push gold higher, as it usually does according to the traditional pattern. But these are extraordinary times and there are too many external factors weighing negatively on the price of the yellow metal.
As if the previous vaccine announcements weren't enough, the latest vaccine trials from AstraZeneca further propelled positive news. And as Trump reluctantly gave Joe Biden the green light towards a transition to the White House, what more can the precious metals do but capitulate? The risky assets train is leaving the station and investors are climbing on board. There simply is no clear catalyst for gold to rally and it can only go further down from here before bottoming.
With this glut of headlines, what news can I possibly give you today? Well, I can tell you about some of the clues that yesterday's decline provided and about one from today's pre-market USD and gold trading.
Let's start with the latter.
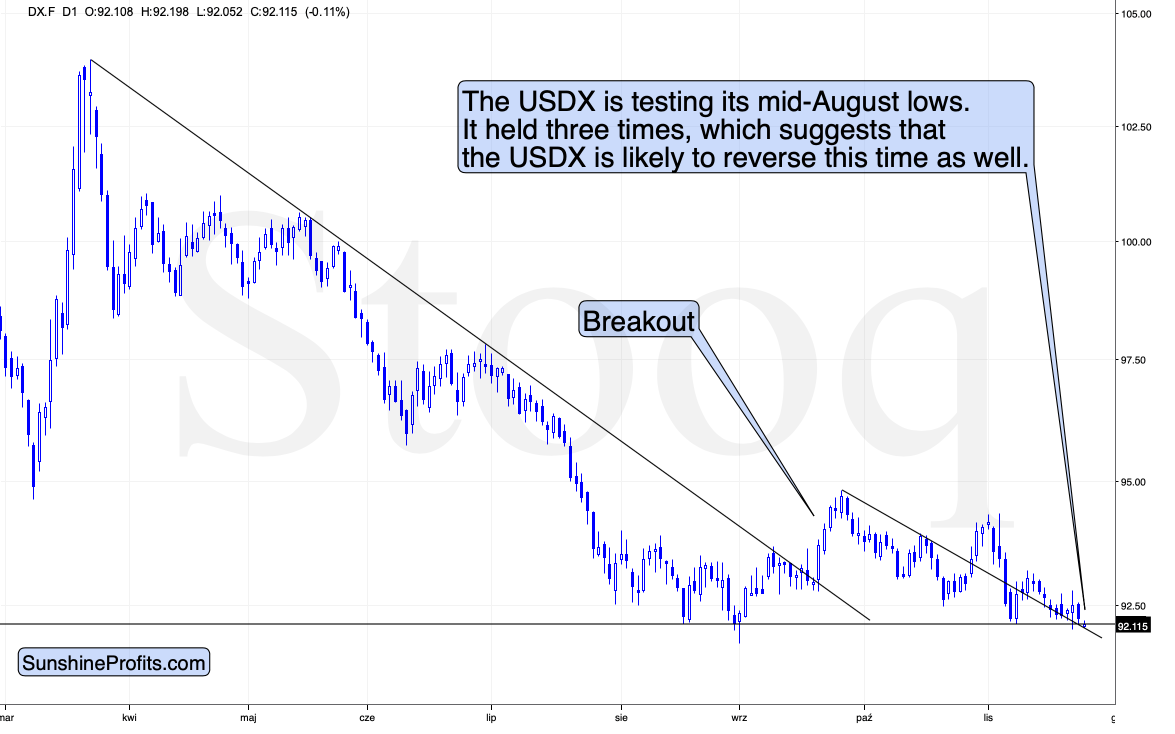
In today's pre-market trading, the USD Index moved slightly lower, and at the moment of writing these words, it finds itself a bit below the mid-August bottom.
The invalidation of the intraday breakdown below this level was what triggered the biggest part of gold's decline on Monday (Nov 23). This might happen again very soon, but this is not the clue that I was writing about earlier. Today's clue is that since the USD Index might be breaking lower here, gold should have reacted with a visible rally – if it was past a bottom.
Gold didn't react with a visible rally. Conversely, gold reacted with a small decline. This subtle clue tells us that gold hasn't formed a bottom yet. And since gold doesn't want to rally from here, and it seems that it's about to get a bearish push from the USD Index (I expect the tiny breakdown to be invalidated just like the previous 3 attempts), we have a quite bearish combination of factors for the yellow metal.
Please note that moves in both the USD Index and gold were relatively small (so they could be invalidated before you read this) but this lowers the bearish implications only a little – after all, for some time in today's pre-market trading gold was definitely moving a bit lower while the USDX was a bit lower as well.
What about the clues from yesterday's session? They are visible on the mining stock chart.
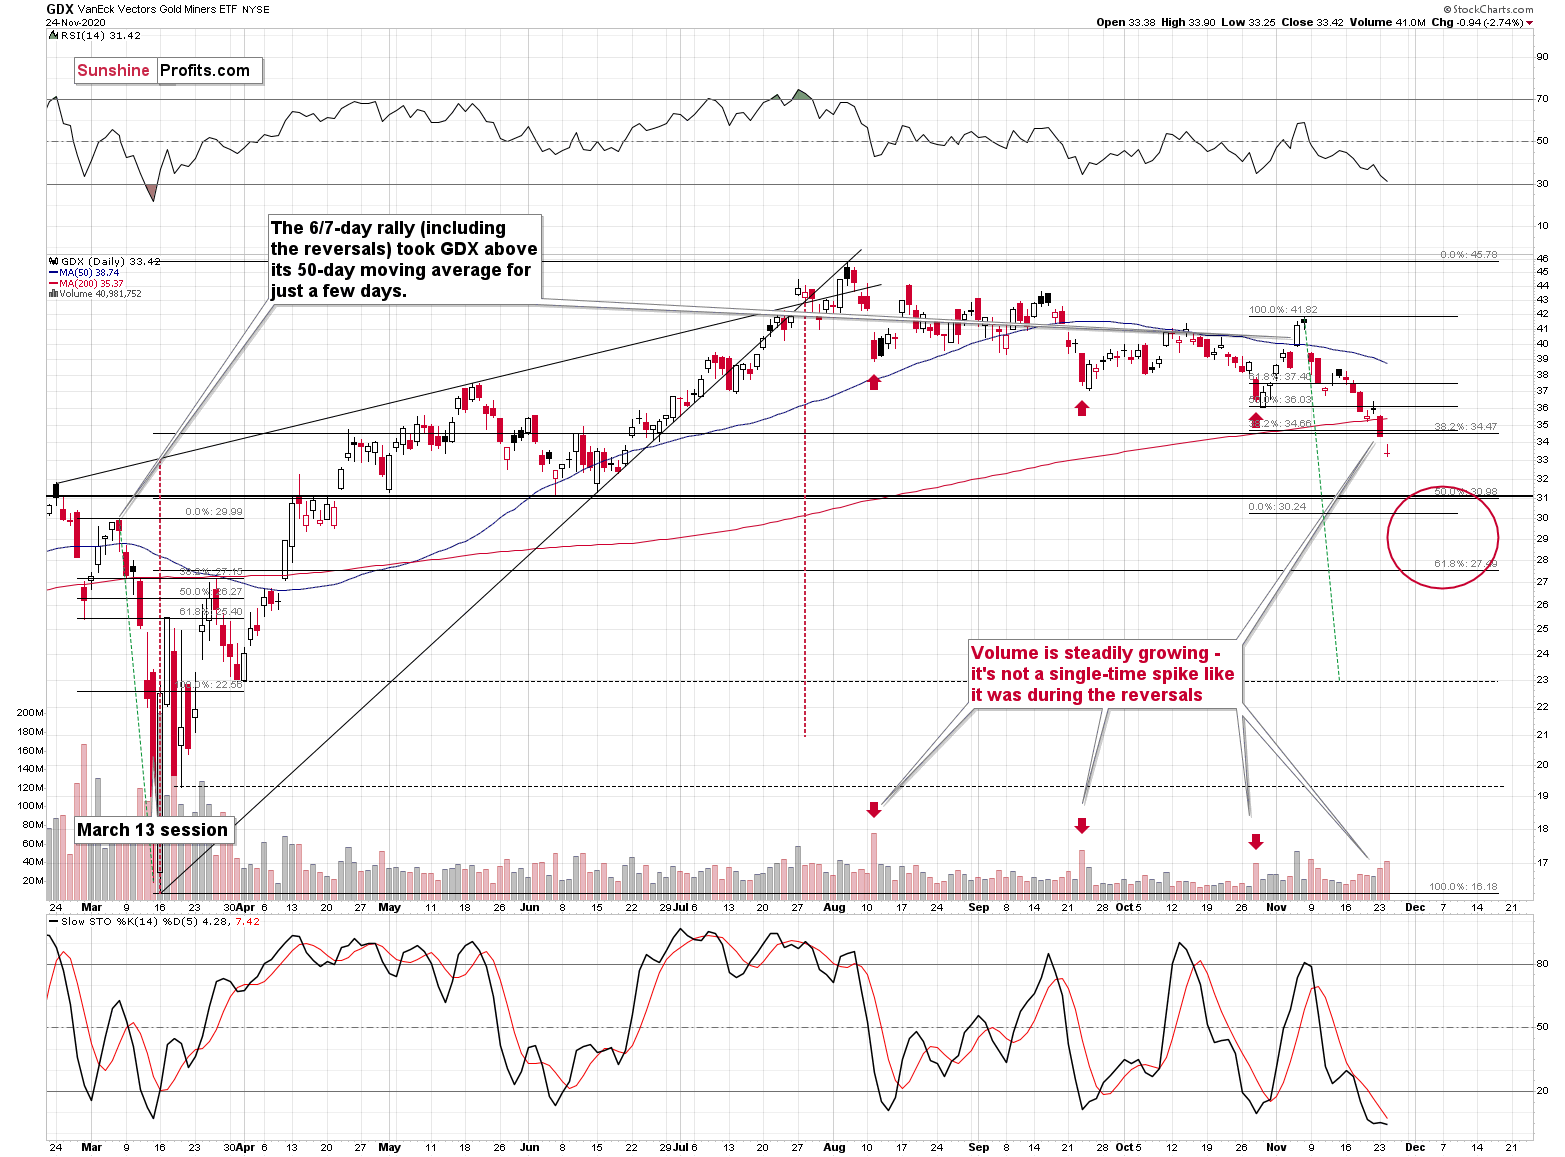
Miners moved lower and while they tried to bounce back, they failed to do so, creating a bearish reversal during the day. This kind of shape during the day's session is bearish in nature. It's especially the case when we see it after a rally (it's a shooting star candlestick or a gravestone doji candlestick in this case), but even during a decline it indicates more weakness. Please note that we already saw that a few times recently: on November 12 and 13, and on October 26.
The shape of yesterday's session is one clue, and the steady buildup in volume as prices decline is another. The August, September, and October bottoms were characterized by a relatively average volume during the declines preceding them, and then a huge spike in volume at the bottom. This time, the volume is also significant in absolute terms, but not in relative terms. The volume is simply increasing as the price moves lower as more and more people become convinced that gold is no longer in a bullish mode.
The RSI indicator is approaching the 30 level, which some might view as bullish, but let's keep in mind that back in March, the bottom was not yet in until the RSI moved into its low 20s.
So, while it's clear that there are counter-trend rallies within any move, it seems that the precious metals market is not yet ready to launch a counter-trend rally right now. And even if it does start this kind of move, it's unlikely that it would be significant. The outlook for the precious metals market remains bearish for the next few weeks.
Want free follow-ups to the above article and details not available to 99%+ investors? Sign up to our free newsletter today!
Want free follow-ups to the above article and details not available to 99%+ investors? Sign up to our free newsletter today!
Author

Przemyslaw Radomski, CFA
Sunshine Profits
Przemyslaw Radomski, CFA (PR) is a precious metals investor and analyst who takes advantage of the emotionality on the markets, and invites you to do the same. His company, Sunshine Profits, publishes analytical software that any


