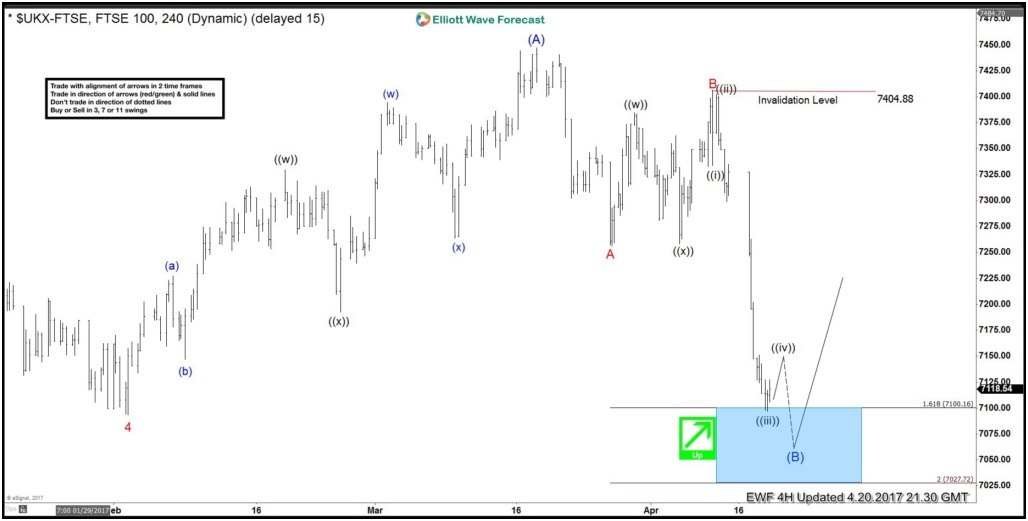
In this technical blog, we are going to take a look at the performance of past Elliott wave FTSE charts from April 2017, which we presented to the clients at elliottwave-forecast.com. Now lets take a look at the 4 hr chart from April 20,2017, which is showing the intermediate cycle in wave (A) in blue unfolded on March 17,2017 peak 7448, below from there intermediate pullback in wave (B) in blue was proposed be in progress as Elliott wave Flat structure. Where Minor wave A in red unfolded in 3 swings (labelled as W,X,Y structure) at 7251 and wave B in red also unfolded in 3 swings (labelled as W,X,Y structure) at 7404 peak. Below from there Minor wave C in red of a flat remained in progress and already showing the enough number of swings within the buying area from the peak. However another marginal push lower was expected within the blue box area (7100-7027) area to complete there as 5 waves structure.

FTSE 4 hour chart

FTSE 4 hour chart

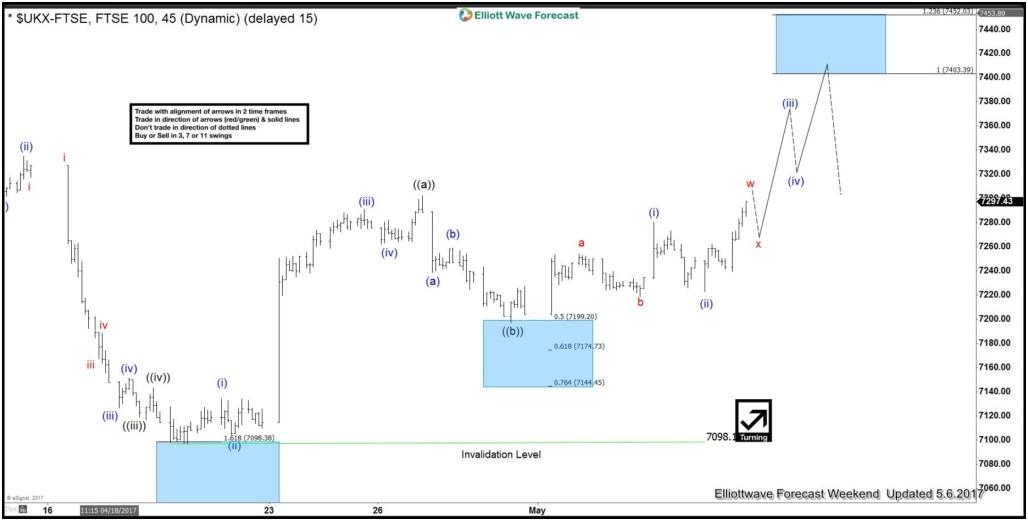
Then we got the nice reaction higher from the mentioned blue box area as expected thus suggesting the intermediate cycle in wave (X) pullback should be completed as Flat structure at 7098 low and allowing our members at elliottwave-forecast,com to create a risk free position in the trade. Also the bounce from 7098 low looks to be unfolding as continuation pattern i.e. Elliott wave Zigzag pattern, where index was expected to trade higher towards 7403-7452 equal legs area of ((a))-((b)) next as far as pivot from 7098 low remains intact.

1 Hour FTSE Elliott Wave Chart

1 Hour FTSE Elliott Wave Chart

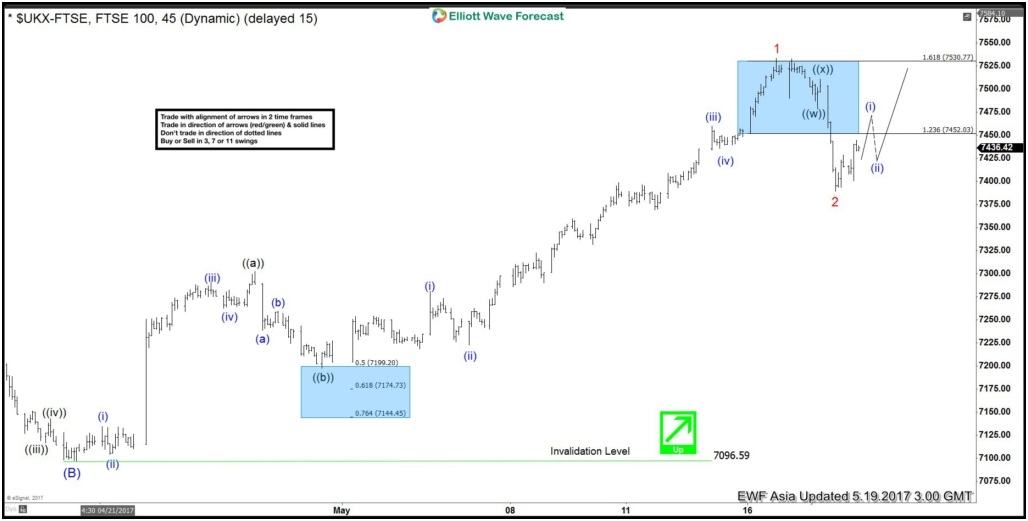
Since then index rallied as expected & has broken above the March 17,2017 peak 7448 already thus suggesting the next leg higher has already started. Index then did a full retest of 1.618% extension area of ((a))-((b)) 7530 before ending the cycle from 7098 low in Minor wave 1 and started the pullback in Minor wave 2 that should expected to find buyer’s against 7098 low in sequence of 3, 7 or 11 swings for further upside.

1 Hour FTSE Elliott Wave Chart

1 Hour FTSE Elliott Wave Chart

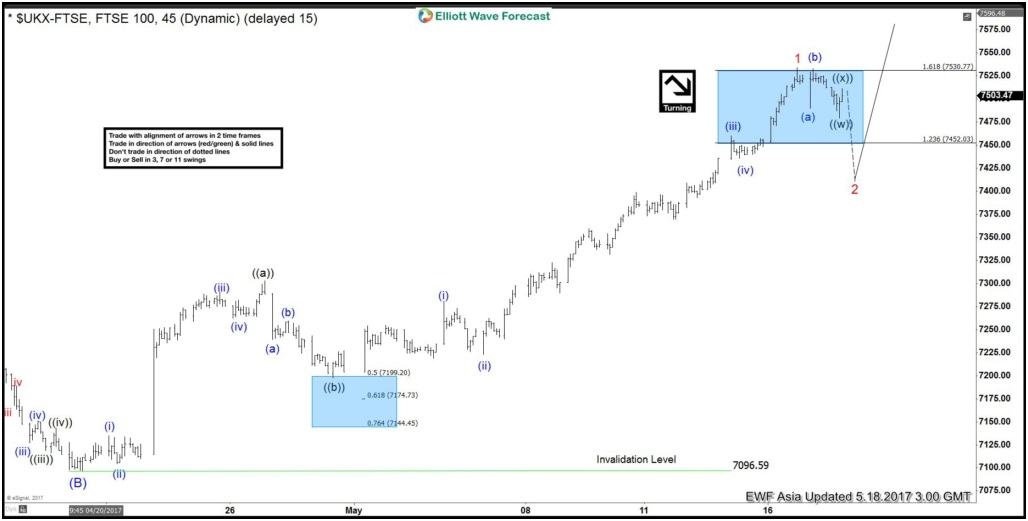
The index already did a 3 swings pullback in Minor wave 2, so the correction of cycle from 7098 low could be done in the index at yesterday’s low 7389, while above there and more importantly as far as pivot from 7098 low remains intact index has scope to resume the rally again.

FTSE Latest 1 Hour Chart

FTSE Latest 1 Hour Chart


Become a Successful Trader and Master Elliott Wave like a Pro. Start your Free 14 Day Trial at - Elliott Wave Forecast.

FURTHER DISCLOSURES AND DISCLAIMER CONCERNING RISK, RESPONSIBILITY AND LIABILITY Trading in the Foreign Exchange market is a challenging opportunity where above average returns are available for educated and experienced investors who are willing to take above average risk. However, before deciding to participate in Foreign Exchange (FX) trading, you should carefully consider your investment objectives, level of xperience and risk appetite. Do not invest or trade capital you cannot afford to lose. EME PROCESSING AND CONSULTING, LLC, THEIR REPRESENTATIVES, AND ANYONE WORKING FOR OR WITHIN WWW.ELLIOTTWAVE- FORECAST.COM is not responsible for any loss from any form of distributed advice, signal, analysis, or content. Again, we fully DISCLOSE to the Subscriber base that the Service as a whole, the individual Parties, Representatives, or owners shall not be liable to any and all Subscribers for any losses or damages as a result of any action taken by the Subscriber from any trade idea or signal posted on the website(s) distributed through any form of social-media, email, the website, and/or any other electronic, written, verbal, or future form of communication . All analysis, trading signals, trading recommendations, all charts, communicated interpretations of the wave counts, and all content from any media form produced by www.Elliottwave-forecast.com and/or the Representatives are solely the opinions and best efforts of the respective author(s). In general Forex instruments are highly leveraged, and traders can lose some or all of their initial margin funds. All content provided by www.Elliottwave-forecast.com is expressed in good faith and is intended to help Subscribers succeed in the marketplace, but it is never guaranteed. There is no “holy grail” to trading or forecasting the market and we are wrong sometimes like everyone else. Please understand and accept the risk involved when making any trading and/or investment decision. UNDERSTAND that all the content we provide is protected through copyright of EME PROCESSING AND CONSULTING, LLC. It is illegal to disseminate in any form of communication any part or all of our proprietary information without specific authorization. UNDERSTAND that you also agree to not allow persons that are not PAID SUBSCRIBERS to view any of the content not released publicly. IF YOU ARE FOUND TO BE IN VIOLATION OF THESE RESTRICTIONS you or your firm (as the Subscriber) will be charged fully with no discount for one year subscription to our Premium Plus Plan at $1,799.88 for EACH person or firm who received any of our content illegally through the respected intermediary’s (Subscriber in violation of terms) channel(s) of communication.

Recommended Content


Recommended Content

Editors’ Picks

EUR/USD holds above 1.0700 ahead of key US data

EUR/USD holds above 1.0700 ahead of key US data

EUR/USD trades in a tight range above 1.0700 in the early European session on Friday. The US Dollar struggles to gather strength ahead of key PCE Price Index data, the Fed's preferred gauge of inflation, and helps the pair hold its ground. 

EUR/USD News

USD/JPY stays above 156.00 after BoJ Governor Ueda's comments

USD/JPY stays above 156.00 after BoJ Governor Ueda's comments

USD/JPY holds above 156.00 after surging above this level with the initial reaction to the Bank of Japan's decision to leave the policy settings unchanged. BoJ Governor said weak Yen was not impacting prices but added that they will watch FX developments closely.

USD/JPY News

Gold price oscillates in a range as the focus remains glued to the US PCE Price Index

Gold price oscillates in a range as the focus remains glued to the US PCE Price Index

Gold price struggles to attract any meaningful buyers amid the emergence of fresh USD buying. Bets that the Fed will keep rates higher for longer amid sticky inflation help revive the USD demand.

Gold News

Sei Price Prediction: SEI is in the zone of interest after a 10% leap

Sei Price Prediction: SEI is in the zone of interest after a 10% leap

Sei price has been in recovery mode for almost ten days now, following a fall of almost 65% beginning in mid-March. While the SEI bulls continue to show strength, the uptrend could prove premature as massive bearish sentiment hovers above the altcoin’s price.

Read more

US core PCE inflation set to signal firm price pressures as markets delay Federal Reserve rate cut bets

US core PCE inflation set to signal firm price pressures as markets delay Federal Reserve rate cut bets

The core PCE Price Index, which excludes volatile food and energy prices, is seen as the more influential measure of inflation in terms of Fed positioning. The index is forecast to rise 0.3% on a monthly basis in March, matching February’s increase. 

Read more

Majors

Cryptocurrencies

Signatures