FTSE MIB 40 H&Si pattern suggests further upsides

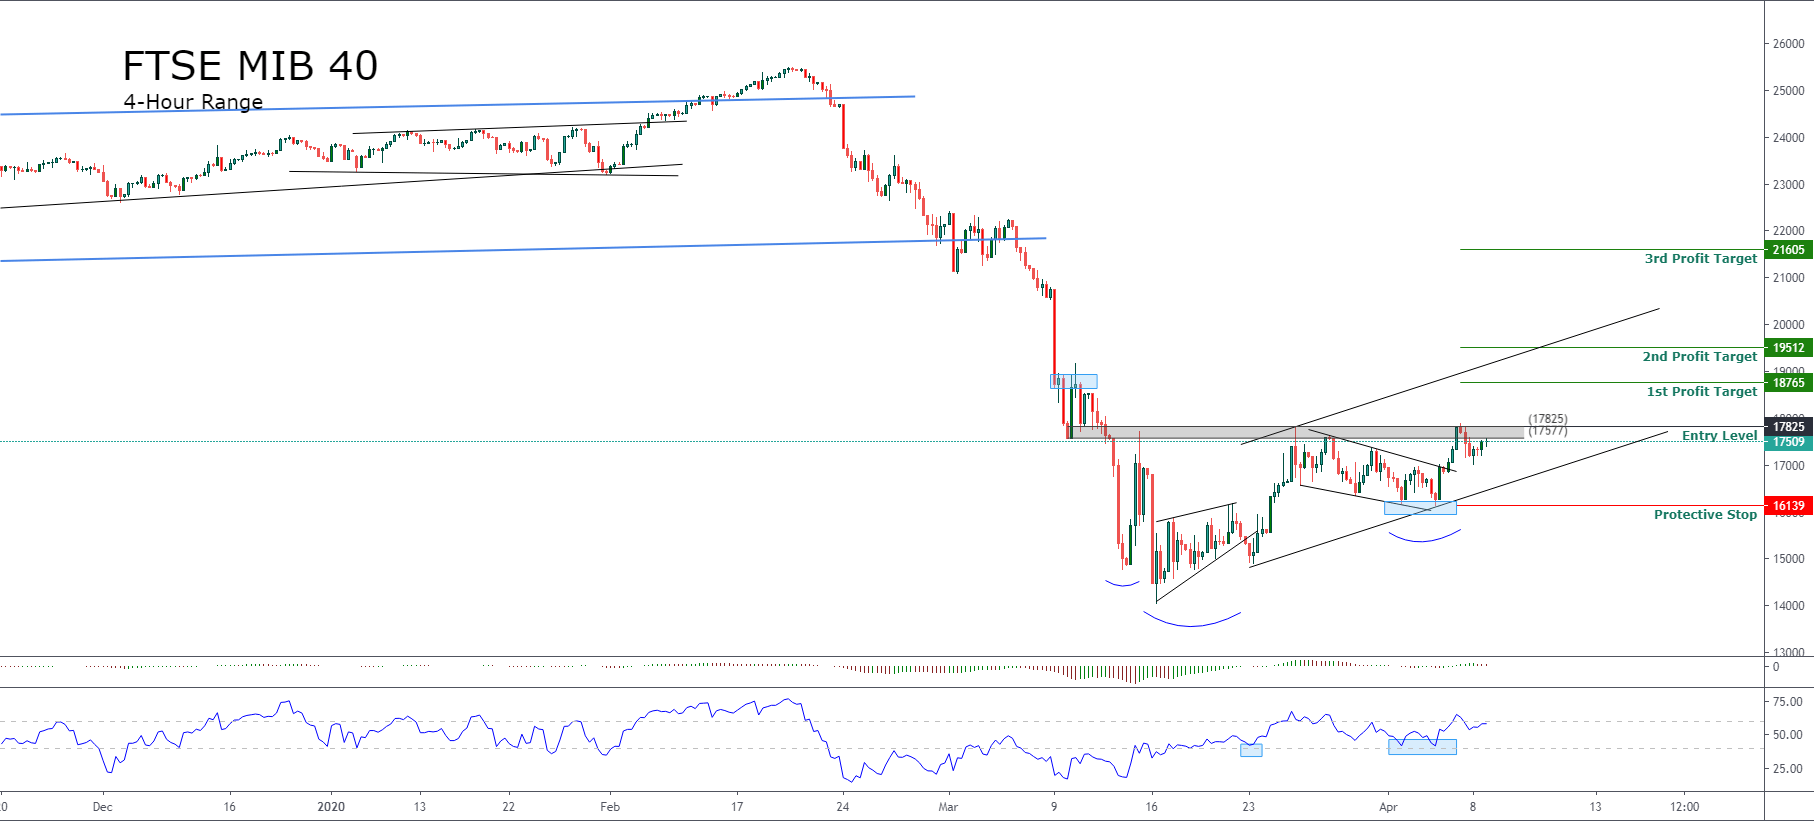
In its 4-hour chart, the Italian FTSE MIB 40 Index shows the price testing a resistance area located between 17,577 and 17,825 pts, which coincides with the low of March 09th when the Italian stock market price accelerated its massive sell-off closing at 17,577 pts.
At the same time, we observe the RSI oscillator bouncing over the 40-level. This bullish reaction leads us to suspect that FTSE MIB 40 should shift to bullish.
On the other hand, in the figure, we distinguish an inverted head & shoulder pattern, which also suggests the possibility of an upward move. This chartist reversal pattern will activate if the price action breaks and closes above 17,825 pts.
In our conservative scenario, we identify a potential first target at 18,765 pts, which corresponds to the following swing after the March 09th's low. Our second target, placed at 19,512 pts, corresponds to the length of the second shoulder. Finally, the third target located at 21,605 pts is the technical target of the inverted Head & Shoulder pattern,
The level that invalidates our bullish scenario is placed at 16,139 pts, which corresponds to the low of the second shoulder.
Trading Plan Summary
- Entry Level: 17,825 pts.
- Protective Stop: 16,139 pts.
- 1st Profit Target: 18,872 pts.
- 2nd Profit Target: 19,512 pts.
- 3rd Profit Target: 21,605 pts.
Author

EagleFX Team
EagleFX
EagleFX Team is an international group of market analysts with skills in fundamental and technical analysis, applying several methods to assess the state and likelihood of price movements on Forex, Commodities, Indices, Metals and


