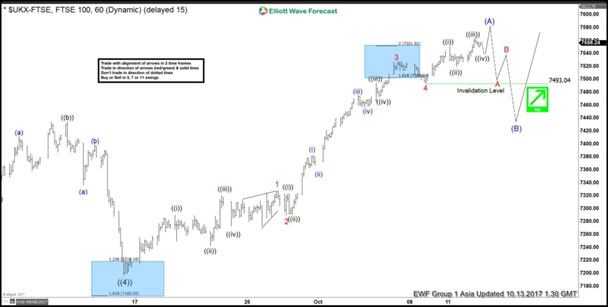
FTSE Short term Elliott Wave analysis suggests decline to 7196.58 ended Primary wave ((4)) on 9/15 low. Up from there, rally in Primary wave ((5)) is unfolding as a zigzag Elliott Wave structure. Intermediate wave (A) of this zigzag structure remains in progress as 5 waves impulse where Minor wave 1 ended at 7327.50 and Minor wave 2 ended at 7289.75. Rally to 7527.59 ended Minor wave 3 and decline to 7493.04 ended Minor wave 4. Cycle from 9/15 low is mature and can end any moment. However, while near term pullbacks stay above 7493.04, Index could see more upside before ending the cycle from 9/15

Chasing the rally higher at this stage is risky as Intermediate wave (A) could end soon. Once Intermediate wave (A) is complete, Index should pullback in Intermediate wave (B) in 3, 7, or 11 swing to correct cycle from 9/15 low (7196.58) before the rally resumes. We do not like selling the Index. We favor extension higher once Intermediate wave (B) pullback has ended later as far as pivot at 9/15 low stays intact.

FTSE 1 Hour Elliott Wave Chart

FTSE

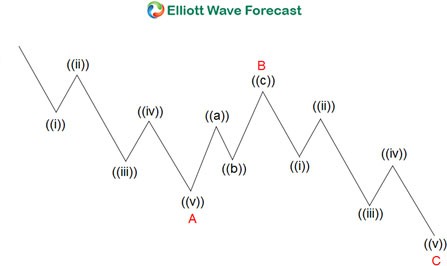
Zigzag is a common Elliott Wave corrective structure. It has internal subdivision of 3 waves and labelled as ABC. The first leg wave A is subdivided in 5 waves and can either be an impulse or a diagonal. The second leg wave B can unfold in any corrective structure. Finally, the third leg wave C is also subdivided into 5 waves and can also be either an impulse or a diagonal. Zigzag therefore is a 5-3-5 Elliott Wave structure. Wave C typically ends at 100% – 123.6% of wave A.

ELLIOTT


ELLIOTT


Become a Successful Trader and Master Elliott Wave like a Pro. Start your Free 14 Day Trial at - Elliott Wave Forecast.

FURTHER DISCLOSURES AND DISCLAIMER CONCERNING RISK, RESPONSIBILITY AND LIABILITY Trading in the Foreign Exchange market is a challenging opportunity where above average returns are available for educated and experienced investors who are willing to take above average risk. However, before deciding to participate in Foreign Exchange (FX) trading, you should carefully consider your investment objectives, level of xperience and risk appetite. Do not invest or trade capital you cannot afford to lose. EME PROCESSING AND CONSULTING, LLC, THEIR REPRESENTATIVES, AND ANYONE WORKING FOR OR WITHIN WWW.ELLIOTTWAVE- FORECAST.COM is not responsible for any loss from any form of distributed advice, signal, analysis, or content. Again, we fully DISCLOSE to the Subscriber base that the Service as a whole, the individual Parties, Representatives, or owners shall not be liable to any and all Subscribers for any losses or damages as a result of any action taken by the Subscriber from any trade idea or signal posted on the website(s) distributed through any form of social-media, email, the website, and/or any other electronic, written, verbal, or future form of communication . All analysis, trading signals, trading recommendations, all charts, communicated interpretations of the wave counts, and all content from any media form produced by www.Elliottwave-forecast.com and/or the Representatives are solely the opinions and best efforts of the respective author(s). In general Forex instruments are highly leveraged, and traders can lose some or all of their initial margin funds. All content provided by www.Elliottwave-forecast.com is expressed in good faith and is intended to help Subscribers succeed in the marketplace, but it is never guaranteed. There is no “holy grail” to trading or forecasting the market and we are wrong sometimes like everyone else. Please understand and accept the risk involved when making any trading and/or investment decision. UNDERSTAND that all the content we provide is protected through copyright of EME PROCESSING AND CONSULTING, LLC. It is illegal to disseminate in any form of communication any part or all of our proprietary information without specific authorization. UNDERSTAND that you also agree to not allow persons that are not PAID SUBSCRIBERS to view any of the content not released publicly. IF YOU ARE FOUND TO BE IN VIOLATION OF THESE RESTRICTIONS you or your firm (as the Subscriber) will be charged fully with no discount for one year subscription to our Premium Plus Plan at $1,799.88 for EACH person or firm who received any of our content illegally through the respected intermediary’s (Subscriber in violation of terms) channel(s) of communication.

Recommended Content


Recommended Content

Editors’ Picks

AUD/USD posts gain, yet dive below 0.6500 amid Aussie CPI, ahead of US GDP

AUD/USD posts gain, yet dive below 0.6500 amid Aussie CPI, ahead of US GDP

The Aussie Dollar finished Wednesday’s session with decent gains of 0.15% against the US Dollar, yet it retreated from weekly highs of 0.6529, which it hit after a hotter-than-expected inflation report. As the Asian session begins, the AUD/USD trades around 0.6495.

AUD/USD News

USD/JPY finds its highest bids since 1990, approaches 156.00

USD/JPY finds its highest bids since 1990, approaches 156.00

USD/JPY broke into its highest chart territory since June of 1990 on Wednesday, peaking near 155.40 for the first time in 34 years as the Japanese Yen continues to tumble across the broad FX market. 

USD/JPY News

Gold stays firm amid higher US yields as traders await US GDP data

Gold stays firm amid higher US yields as traders await US GDP data

Gold recovers from recent losses, buoyed by market interest despite a stronger US Dollar and higher US Treasury yields. De-escalation of Middle East tensions contributed to increased market stability, denting the appetite for Gold buying.

Gold News

Ethereum suffers slight pullback, Hong Kong spot ETH ETFs to begin trading on April 30

Ethereum suffers slight pullback, Hong Kong spot ETH ETFs to begin trading on April 30

Ethereum suffered a brief decline on Wednesday afternoon despite increased accumulation from whales. This follows Ethereum restaking protocol Renzo restaked ETH crashing from its 1:1 peg with ETH and increased activities surrounding spot Ethereum ETFs.

Read more

Dow Jones Industrial Average hesitates on Wednesday as markets wait for key US data

Dow Jones Industrial Average hesitates on Wednesday as markets wait for key US data

The DJIA stumbled on Wednesday, falling from recent highs near 38,550.00 as investors ease off of Tuesday’s risk appetite. The index recovered as US data continues to vex financial markets that remain overwhelmingly focused on rate cuts from the US Fed.

Read more

Majors

Cryptocurrencies

Signatures