Hello fellow traders. In this technical blog we’re going to take a quick look at the past Elliott Wave charts of  FTSE published in members area of www.elliottwave-forecast.com. In further text we’re going to count the swings, explain the Elliott Wave view.
As our members know, we were explaining that FTSE is having incomplete bullish swings sequences in weekly cycle from the 2009 low. Due to incomplete sequences we knew that Index will keep finding buyers in3,7,11 swings. We recommended our members to avoid selling the index, keep favoring the long side.

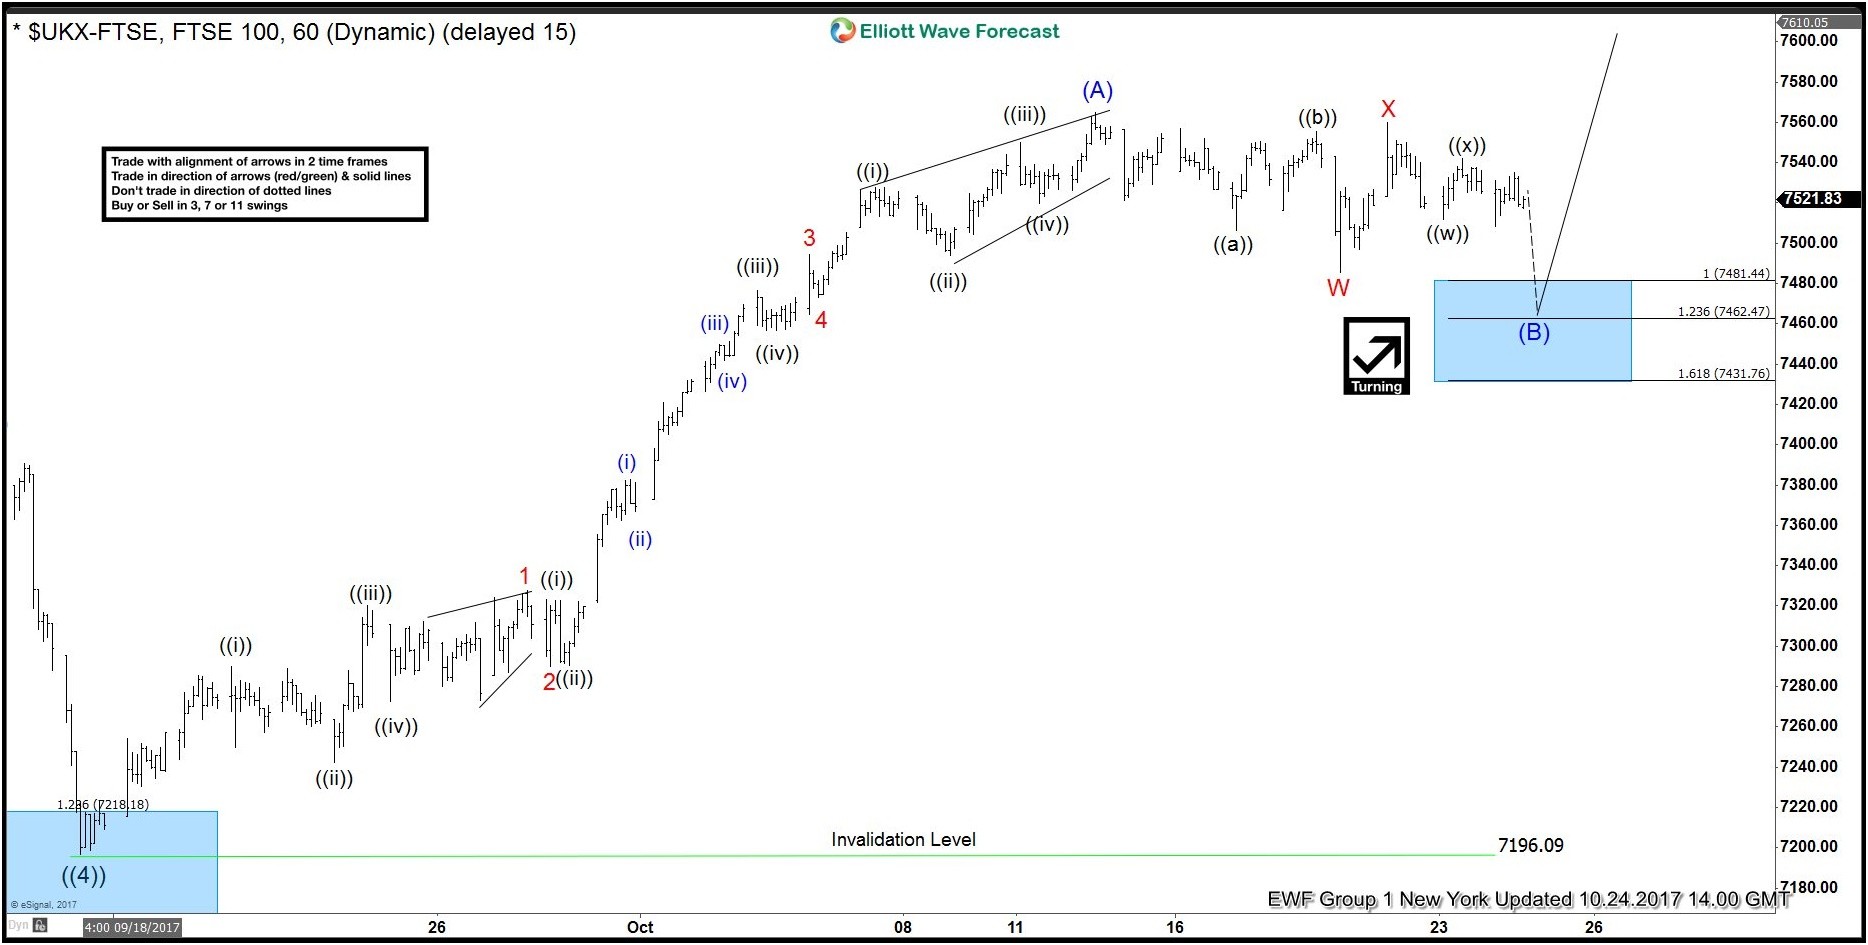
FTSE Elliott Wave 1 Hour Chart 10.24.2017

Cycle from the 7196.01 has unfolded as 5 waves structure labeled as wave (A) blue. Although it’s not showing high-probability tradable sequences in lower time frame, we knew that index will keep finding buyers after completing 7 swings. Currently FTSE is proposed to be doing (B) blue pull back, correcting the entire cycle from the 1796 low. We’re expecting another leg lower ( 7th swing) toward 7481.44-7431.76 area, before buyers appear for further rally ideally.  Proposed pull back is unfolding as Double Double Three structure WXY.

FTSE

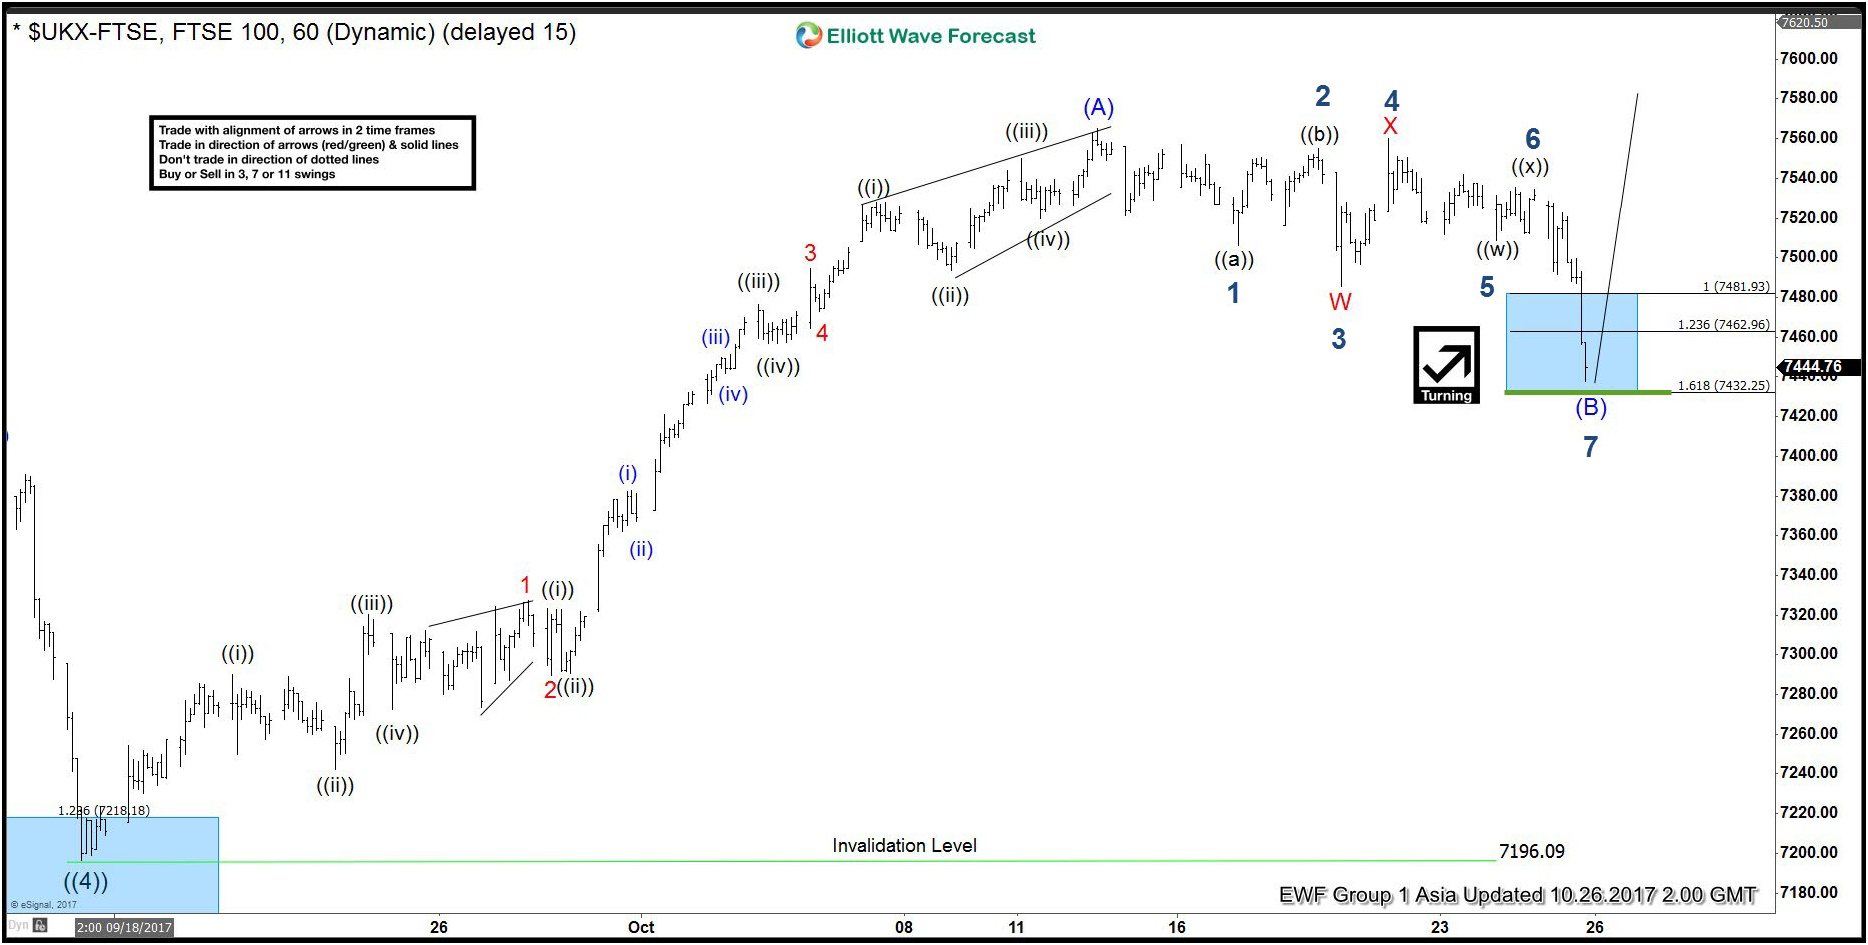
FTSE Elliott Wave 1 Hour Chart 10.26.2017

We got proposed push lower in 7th swing. Sellers were strong and manage to break below 1.236 Fibo Extension:7462.96. However, the price still holds above 1.618 Fibo extension:7432.25 and while it holds that level, we expect buyers to appear for further rally ideally or 3 wave bounce alternatively. Pull back is at the extreme, and about to complete as 7 swings structure (labeled on the chart below).

FTSE

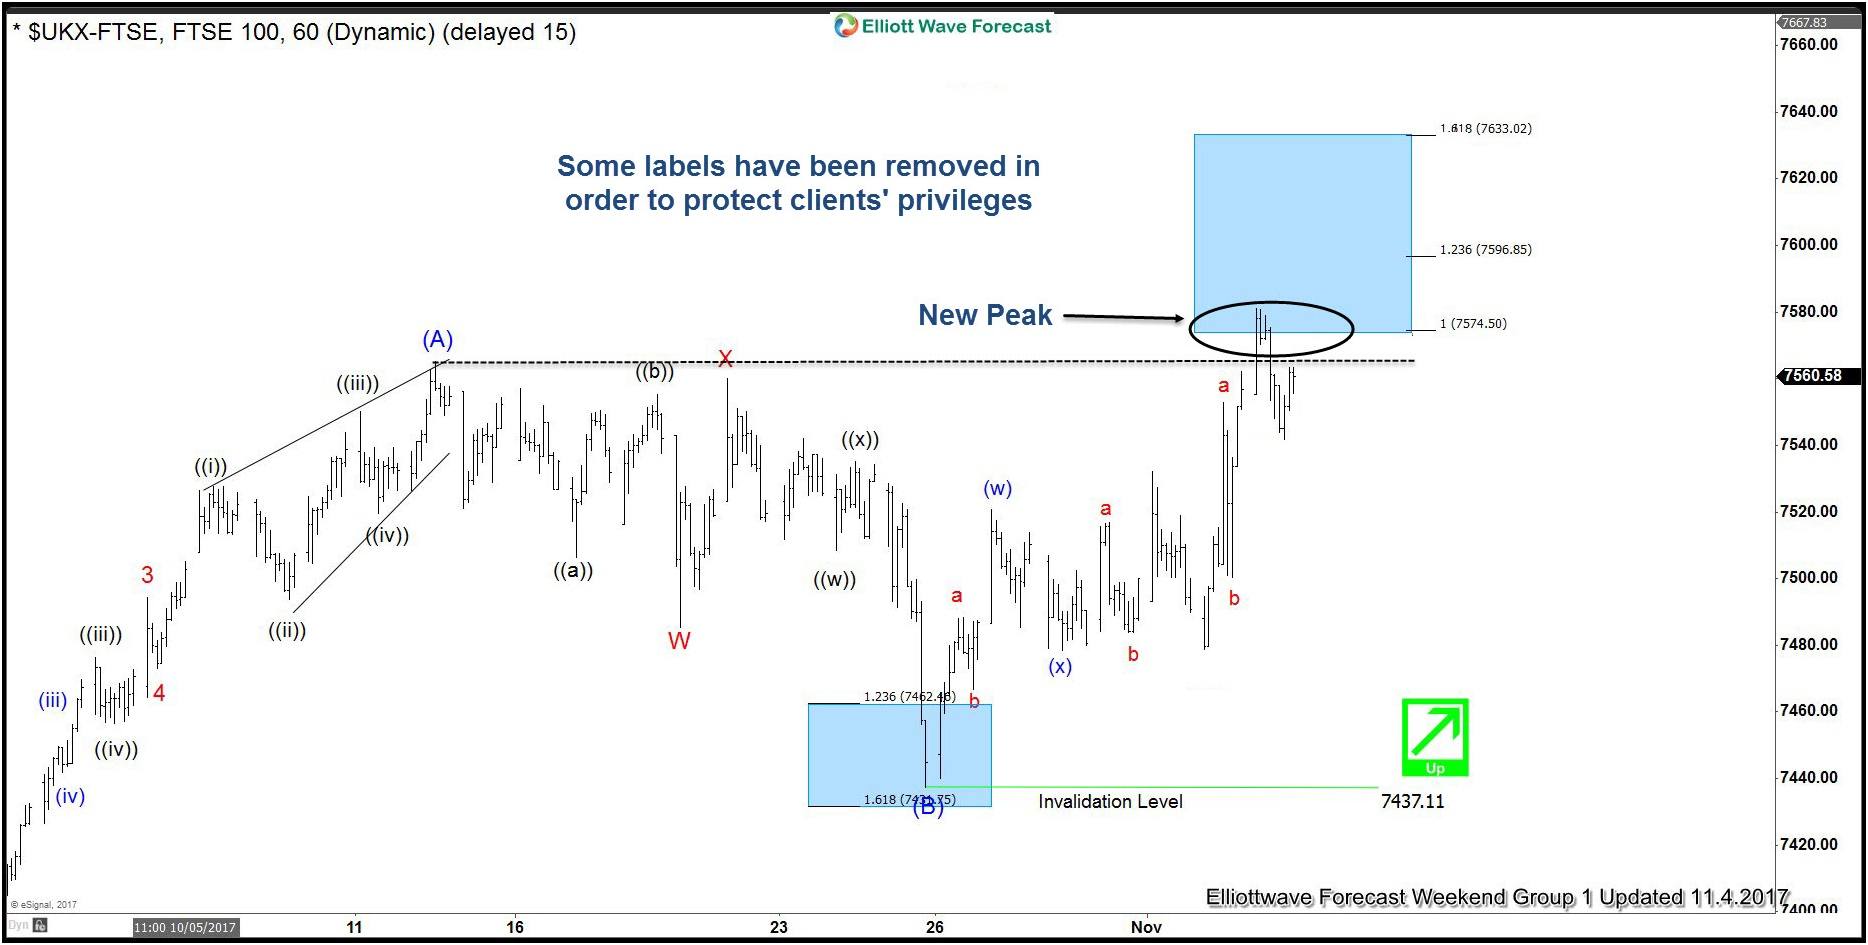
FTSE Elliott Wave 1Hour Chart 11.14.2017

FTSE held above 1.618 Fibo extension (7432.25) and found buyers as expected. After ending 7 swings correction as wave (B) blue, the index has rallied, making nice sepparation from the inflection area . Eventually FTSE has made the new peak. The price has reached short term technical area 7574.5-7596.8, which represent extreme zone in the short term cycle from the 7437.11 low. Short term traders will be taking profits and we might see pull back from there.  Current price action is interesting and believe that we’re having clear path for the period of next few weeks . We have removed labels to protect our clients’ priviliges. If you’re interested in new Elliott Wave forecasts of FTSE , you can find them in the membership area of EWF. If you’re not a member yet, all you have to do is Sign up  here for Free 14 Days Trial.

FTSE

Elliott Wave Forecast

We cover 78 instruments in total, but not every chart is trading recommendation. We present Official Trading Recommendations in Live Trading Room. If not a member yet, Sign Up for Free 14 Days Trial Now and get access to new trading opportunities.


Become a Successful Trader and Master Elliott Wave like a Pro. Start your Free 14 Day Trial at - Elliott Wave Forecast.

FURTHER DISCLOSURES AND DISCLAIMER CONCERNING RISK, RESPONSIBILITY AND LIABILITY Trading in the Foreign Exchange market is a challenging opportunity where above average returns are available for educated and experienced investors who are willing to take above average risk. However, before deciding to participate in Foreign Exchange (FX) trading, you should carefully consider your investment objectives, level of xperience and risk appetite. Do not invest or trade capital you cannot afford to lose. EME PROCESSING AND CONSULTING, LLC, THEIR REPRESENTATIVES, AND ANYONE WORKING FOR OR WITHIN WWW.ELLIOTTWAVE- FORECAST.COM is not responsible for any loss from any form of distributed advice, signal, analysis, or content. Again, we fully DISCLOSE to the Subscriber base that the Service as a whole, the individual Parties, Representatives, or owners shall not be liable to any and all Subscribers for any losses or damages as a result of any action taken by the Subscriber from any trade idea or signal posted on the website(s) distributed through any form of social-media, email, the website, and/or any other electronic, written, verbal, or future form of communication . All analysis, trading signals, trading recommendations, all charts, communicated interpretations of the wave counts, and all content from any media form produced by www.Elliottwave-forecast.com and/or the Representatives are solely the opinions and best efforts of the respective author(s). In general Forex instruments are highly leveraged, and traders can lose some or all of their initial margin funds. All content provided by www.Elliottwave-forecast.com is expressed in good faith and is intended to help Subscribers succeed in the marketplace, but it is never guaranteed. There is no “holy grail” to trading or forecasting the market and we are wrong sometimes like everyone else. Please understand and accept the risk involved when making any trading and/or investment decision. UNDERSTAND that all the content we provide is protected through copyright of EME PROCESSING AND CONSULTING, LLC. It is illegal to disseminate in any form of communication any part or all of our proprietary information without specific authorization. UNDERSTAND that you also agree to not allow persons that are not PAID SUBSCRIBERS to view any of the content not released publicly. IF YOU ARE FOUND TO BE IN VIOLATION OF THESE RESTRICTIONS you or your firm (as the Subscriber) will be charged fully with no discount for one year subscription to our Premium Plus Plan at $1,799.88 for EACH person or firm who received any of our content illegally through the respected intermediary’s (Subscriber in violation of terms) channel(s) of communication.

Recommended Content


Recommended Content

Editors’ Picks

AUD/USD rises to two-day high ahead of Aussie CPI

AUD/USD rises to two-day high ahead of Aussie CPI

The Aussie Dollar recorded back-to-back positive days against the US Dollar and climbed more than 0.59% on Tuesday, as the US April S&P PMIs were weaker than expected. That spurred speculations that the Federal Reserve could put rate cuts back on the table. The AUD/USD trades at 0.6488 as Wednesday’s Asian session begins.

AUD/USD News

EUR/USD now refocuses on the 200-day SMA

EUR/USD now refocuses on the 200-day SMA

EUR/USD extended its positive momentum and rose above the 1.0700 yardstick, driven by the intense PMI-led retracement in the US Dollar as well as a prevailing risk-friendly environment in the FX universe.

EUR/USD News

Gold price cautious despite weaker US Dollar and falling US yields

Gold price cautious despite weaker US Dollar and falling US yields

Gold retreats modestly after failing to sustain gains despite fall in US Treasury yields, weaker US Dollar. XAU/USD struggles to capitalize following release of weaker-than-expected S&P Global PMIs, fueling speculation about potential Fed rate cuts.

Gold News

Ethereum ETF issuers not giving up fight, expert says as Grayscale files S3 prospectus

Ethereum ETF issuers not giving up fight, expert says as Grayscale files S3 prospectus

Ethereum exchange-traded funds theme gained steam after the landmark approval of multiple BTC ETFs in January. However, the campaign for approval of this investment alternative continues, with evidence of ongoing back and forth between prospective issuers and the US SEC.

Read more

Australia CPI Preview: Inflation set to remain above target as hopes of early interest-rate cuts fade

Australia CPI Preview: Inflation set to remain above target as hopes of early interest-rate cuts fade

An Australian inflation update takes the spotlight this week ahead of critical United States macroeconomic data. The Australian Bureau of Statistics will release two different inflation gauges on Wednesday.

Read more

Majors

Cryptocurrencies

Signatures