US Dollar: Dec USD is Down at 96.835.

Energies: Jan'20 Crude is Up at 59.74.

Financials: The Mar'20 30 year bond is Down 6 ticks and trading at 156.19.

Indices: The Dec S&P 500 emini ES contract is 64 ticks Higher and trading at 3184.00.

Gold: The Feb'20 Gold contract is trading Up at 1474.60. Gold is 25 ticks Higher than its close.


Initial Conclusion

This is a nearly correlated market.  The dollar is Down- and Crude is Up+  which is normal and the 30 year Bond is trading Lower.  The Financials should always correlate with the US dollar such that if the dollar is lower then bonds should follow and vice-versa. The S&P is Higher and Crude is trading Higher which is not correlated. Gold is trading Higher which is correlated with the US dollar trading Down.   I tend to believe that Gold has an inverse relationship with the US Dollar as when the US Dollar is down, Gold tends to rise in value and vice-versa. Think of it as a seesaw, when one is up the other should be down. I point this out to you to make you aware that when we don't have a correlated market, it means something is wrong. As traders you need to be aware of this and proceed with your eyes wide open.

At this time all of Asia is trading Higher. Currently all of Europe is trading Higher as well.


Possible Challenges To Traders Today:

  • Retail Sales is out at 8:30 AM EST.  This is Major.

  • Core Retail Sales is out at 8:30 AM EST.  This is Major.

  • Import Prices is out at 8:30 AM EST.  This is Major.

  • Business Inventories is out at 10 AM EST.  This is Major.

  • FOMC Member Williams Speaks  at 11 AM EST.  This is Major.


Treasuries

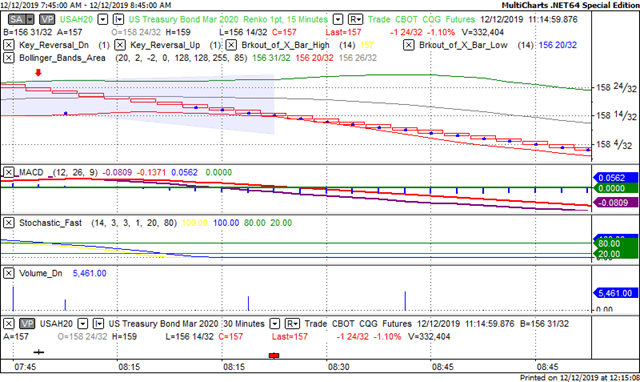
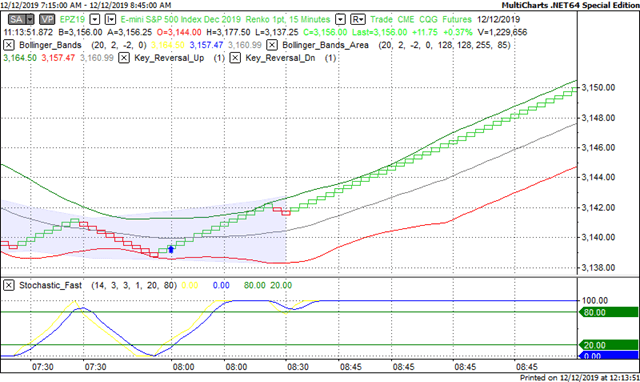
We've elected to switch gears a bit and show correlation between the 30 year bond (ZB) and The S&P futures contract.  The S&P contract is the Standard and Poor's and the purpose is to show reverse correlation between the two instruments.  Remember it's liken to a seesaw, when up goes up the other should go down and vice versa.

Yesterday the ZB made a major move at around 8 AM EST.  The ZB hit a High at around that time and the S&P moved Higher.  If you look at the charts below ZB gave a signal at around 8 AM EST and the S&P moved Higher at the same time.  Look at the charts below and you'll see a pattern for both assets. ZB hit a High at around 8 AM and the S&P was moving Higher shortly thereafter.  These charts represent the newest version of MultiCharts and I've changed the timeframe to a 15 minute chart to display better.  This represented a Shorting opportunity on the 30 year bond, as a trader you could have netted about 30 plus ticks per contract on this trade.  Each tick is worth $31.25.  Please note: the front month for the ZB is now March '20.  The S&P contract is still  December.  I've changed the format to Renko bars such that it may be more apparent and visible.  


Charts Courtesy of MultiCharts built on an AMP platform

ZB


SP


Bias

Yesterday we gave the markets a Neutral bias as we didn't see any evidence of correlation hence the Neutral bias.  The Dow gained 221 points and the other indices gained ground as well.  Today we are dealing with a nearly correlated market and it's correalted to he Upside, hence our bias is to the Upside.

Could this change? Of Course. Remember anything can happen in a volatile market. 


Commentary

Yesterday we started the day off with a Neutral bias as just about all the instruments we use for market correlation purposes were all pointed Higher. Whenever we have a situation whereby everything is either pointed Higher or conversely pointed Lower, then there is no correlation. The markets rose yesterday based on the news that a trade deal with China is forthcoming, hence the Upward trend. We’ve heard this news before so until we know it’s real, it’s pretty much speculation.

Trading performance displayed herein is hypothetical. The following Commodity Futures Trading Commission (CFTC) disclaimer should be noted.

Hypothetical performance results have many inherent limitations, some of which are described below. No representation is being made that any account will or is likely to achieve profits or losses similar to those shown.

In fact, there are frequently sharp differences between hypothetical performance results and the actual results subsequently achieved by any particular trading program. One of the limitations of hypothetical performance trading results is that they are generally prepared with the benefit of hindsight.

In addition, hypothetical trading does not involve financial risk, and no hypothetical trading record can completely account for the impact of financial risk in actual trading. For example, the ability to withstand losses or to adhere to a particular trading program in spite of trading losses are material points which can also adversely affect actual trading results.

There are numerous other factors related to the markets in general or to the implementation of any specific trading program which cannot be fully accounted for in the preparation of hypothetical performance results and all of which can adversely affect actual trading results.

Trading in the commodities markets involves substantial risk and YOU CAN LOSE A LOT OF MONEY, and thus is not appropriate for everyone. You should carefully consider your financial condition before trading in these markets, and only risk capital should be used.

In addition, these markets are often liquid, making it difficult to execute orders at desired prices. Also, during periods of extreme volatility, trading in these markets may be halted due to so-called “circuit breakers” put in place by the CME to alleviate such volatility. In the event of a trading halt, it may be difficult or impossible to exit a losing position.

Recommended Content


Recommended Content

Editors’ Picks

AUD/USD rises to two-day high ahead of Aussie CPI

AUD/USD rises to two-day high ahead of Aussie CPI

The Aussie Dollar recorded back-to-back positive days against the US Dollar and climbed more than 0.59% on Tuesday, as the US April S&P PMIs were weaker than expected. That spurred speculations that the Federal Reserve could put rate cuts back on the table. The AUD/USD trades at 0.6488 as Wednesday’s Asian session begins.

AUD/USD News

EUR/USD now refocuses on the 200-day SMA

EUR/USD now refocuses on the 200-day SMA

EUR/USD extended its positive momentum and rose above the 1.0700 yardstick, driven by the intense PMI-led retracement in the US Dollar as well as a prevailing risk-friendly environment in the FX universe.

EUR/USD News

Gold price on the defensive, amid soft US Dollar

Gold price on the defensive, amid soft US Dollar

Gold retreats modestly after failing to sustain gains despite fall in US Treasury yields, weaker US Dollar. XAU/USD struggles to capitalize following release of weaker-than-expected S&P Global PMIs, fueling speculation about potential Fed rate cuts.

Gold News

Ethereum continues hinting at rally following reduced long liquidations

Ethereum continues hinting at rally following reduced long liquidations

Ethereum has continued showing signs of a potential rally on Tuesday as most coins in the crypto market are also posting gains. This comes amid speculation of a potential decline following FTX ETH sales and normalizing ETH risk reversals.

Read more

Australia CPI Preview: Inflation set to remain above target as hopes of early interest-rate cuts fade

Australia CPI Preview: Inflation set to remain above target as hopes of early interest-rate cuts fade

An Australian inflation update takes the spotlight this week ahead of critical United States macroeconomic data. The Australian Bureau of Statistics will release two different inflation gauges on Wednesday. 

Read more

Majors

Cryptocurrencies

Signatures