Friday the 13th

Good Morning Traders,
As of this writing 4:15 AM EST, here’s what we see:
US Dollar: Sept. USD is Up at 94.915.
Energies: Aug '18 Crude is Down at 70.11.
Financials: The Sept 30 year bond is Up 5 ticks and trading at 145.14.
Indices: The Sept S&P 500 emini ES contract is 20 ticks Higher and trading at 2803.50.
Gold: The Aug gold contract is trading Down at 1241.60. Gold is 50 ticks Lower than its close.
Initial Conclusion
This is not a correlated market. The dollar is Up+ and Crude is Down- which is normal and the 30 year Bond is trading Higher. The Financials should always correlate with the US dollar such that if the dollar is lower then bonds should follow and vice-versa. The S&P is Higher and Crude is trading Lower which is correlated. Gold is trading Down- which is correlated with the US dollar trading Up+. I tend to believe that Gold has an inverse relationship with the US Dollar as when the US Dollar is down, Gold tends to rise in value and vice-versa. Think of it as a seesaw, when one is up the other should be down. I point this out to you to make you aware that when we don't have a correlated market, it means something is wrong. As traders you need to be aware of this and proceed with your eyes wide open.
At this hour all of Asia is trading Higher with the exception of the Shanghai exchange which is down fractionally. As of this writing Europe is trading mainly Higher with the exception of the Spanish IBEX exchange which is Lower at this time.
Possible Challenges To Traders Today
-
Import Prices m/m is out at 8:30 AM EST. This is not major.
-
Prelim UoM Consumer Sentiment is out at 10 AM EST. This is major.
-
Revised UoM Inflation Expectations is out at 10 AM EST. Major.
-
Fed Monetary Policy Report is out at 11 AM EST. This is major.
Treasuries
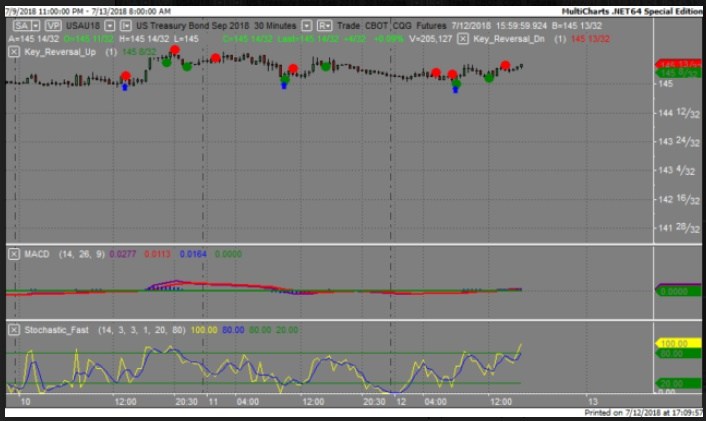
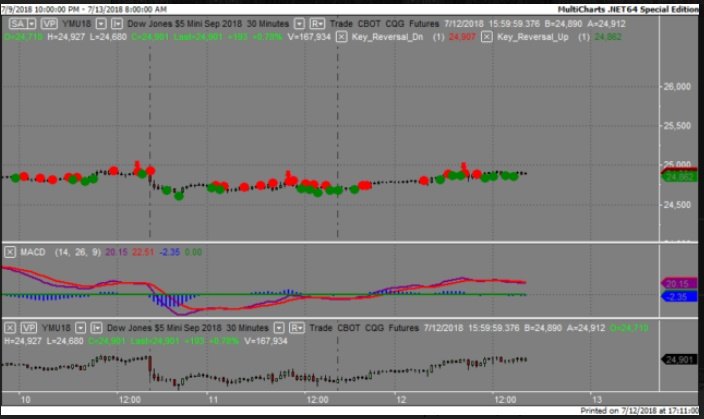
We've elected to switch gears a bit and show correlation between the 30 year bond (ZB) and The YM futures contract. The YM contract is the DJIA and the purpose is to show reverse correlation between the two instruments. Remember it's liken to a seesaw, when up goes up the other should go down and vice versa.
Yesterday the ZB made it's move at around 8 AM EST. The ZB hit a Low at around that time and the YM hit a High. If you look at the charts below ZB gave a signal at around 8 AM EST and the YM was moving Lower at the same time. Look at the charts below and you'll see a pattern for both assets. ZB hit a Low at around 8 AM and the YM was moving Lower at the same time. These charts represent the newest version of MultiCharts and I've changed the timeframe to a 30 minute chart to display better. This represented a long opportunity on the 30 year bond, as a trader you could have netted about a dozen ticks per contract on this trade. Each tick is worth $31.25.
Charts Courtesy of MultiCharts built on an AMP platform.
Bias
Yesterday we gave the markets an Upside bias as the USD and the Bonds were trading Lower Thursday morning and tis usually reflects an Upside day. The markets didn't disappoint as the Dow rose by 224 points and the other indices rose higher as well. Today we aren't dealing with a correlated market and our bias is Neutral.
Could this change? Of Course. Remember anything can happen in a volatile market.
Commentary
Yesterday the markets decided to shrug off any talk regarding trade wars and rose higher. Why do we think this happened? The Smart Money decided to go higher and moved the markets accordingly; additionally Asia rose higher in the overnight session Wednesday evening and this served as a catalyst to move the markets, Europe closed Higher as well. Today being Friday the 13th do we avoid the markets all together? Only time will tell.
Author

Nick Mastrandrea
Market Tea Leaves


