French Election Overshadows Markets

US Dollar: Jun. USD is Down at 98.995.
Energies: May Crude is Up at 49.96.
Financials: The June 30 year bond is Down 40 ticks and trading at 152.29.
Indices: The June S&P 500 emini ES contract is 95 ticks Higher and trading at 2371.25.
Gold: The April gold contract is trading Down at 1273.30. Gold is 157 ticks Lower than its close.
Initial Conclusion
This is not a correlated market. The dollar is Down- and crude is Up+ which is normal and the 30 year bond is trading Lower. The Financials should always correlate with the US dollar such that if the dollar is lower then bonds should follow and vice-versa. The indices are Up+ and Crude is trading Down- which is correlated. Gold is trading Down- which is not correlated with the US dollar trading Down-. I tend to believe that Gold has an inverse relationship with the US Dollar as when the US Dollar is down, Gold tends to rise in value and vice-versa. Think of it as a seesaw, when one is up the other should be down. I point this out to you to make you aware that when we don’t have a correlated market, it means something is wrong. As traders you need to be aware of this and proceed with your eyes wide open.
At this hour Asia is trading Higher with the exception of the Shanghai exchange which is trading Lower. As of this writing all of Europe is trading Higher.
Possible Challenges To Traders Today
– FOMC Member Kashkari Speaks at 11:30 AM EST. This is major.
– FOMC Member Kashkari Speaks at 3:15 PM EST. This is major.
Treasuries
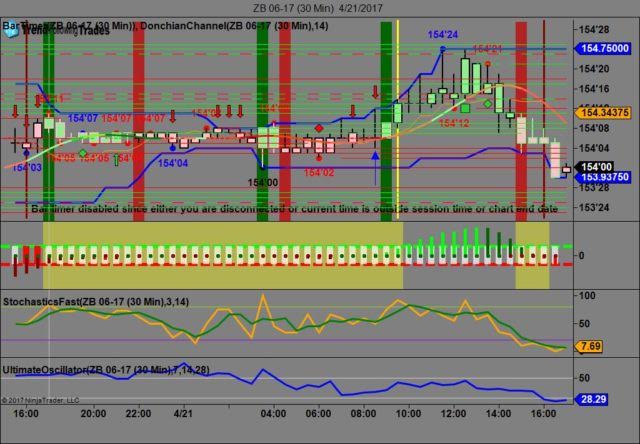
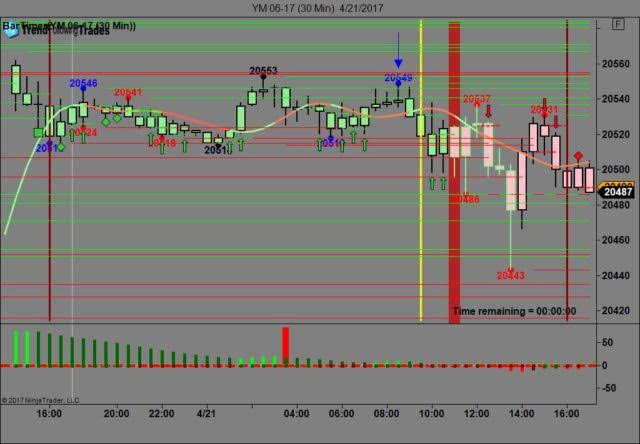
We’ve elected to switch gears a bit and show correlation between the 30 year bond (ZB) and The YM futures contract. The YM contract is the DJIA and the purpose is to show reverse correlation between the two instruments. Remember it’s liken to a seesaw, when up goes up the other should go down and vice versa.
On Friday the ZB made it’s move at around 8:30 AM with no economic news in sight. The ZB hit a low at around that time and the YM hit a high. If you look at the charts below ZB gave a signal at around 8:30 AM and the YM was moving lower at the same time. Look at the charts below and you’ll see a pattern for both assets. ZB hit a low at around 8:30 AM and the YM hit a high. These charts represent the newest version of Trend Following Trades and I’ve changed the timeframe to a 30 minute chart to display better. This represented a long opportunity on the 30 year bond, as a trader you could have netted about 20 ticks per contract on this trade. Each tick is worth $31.25. We added a Donchian Channel to the charts to show the signals more clearly.
Charts Courtesy of Trend Following Trades built on a NinjaTrader platform.
Bias
On Friday we gave the markets a neutral bias as we didn’t see the indices moving with any sense of conviction. The Dow dropped 31 points and the other indices lost ground as well. Today we aren’t dealing with a correlated market however our bias is to the upside.
Could this change? Of Course. Remember anything can happen in a volatile market.
Commentary
Late last week all the markets kept talking about was the French Presidential elections as depending upon who wins will determine market reaction. If you were to ask any reporter covering this election, they would say it is the nastiest election in French history as all the candidates keep doing is throwing mud at one another. Gee, does this sound at all familiar? It seems that candidate Marine Le Pen is the French equivalent to Donald Trump and wants to exit France from the EU in a move called Frexit. So what will happen if Marine Le Pen wins? The USD will strengthen and the Euro will lose value. This is not necessarily good for the US as America wants to keep the USD as low as possible to stimulate exports. One thing I have to say about candidate Le Pen, she is an excellent speaker and talks with true passion regarding what she believes. In light of what has happened in Paris lately, it wouldn’t surprise us if she won…
Author

Nick Mastrandrea
Market Tea Leaves


