Forming a Reluctant Top

Market overview:
As anticipated, SPX did not stop precisely at 2500, but pushed higher to almost 2509 before reversing. That reversal probably means that we have made a top, but what kind of a top is still undecided. There is a cycle low due in early October which could well take the index down into that time frame, but there has not been enough distribution to initiate more than a fifty-point decline at this time. It is uncertain what will come next, but there is another minor cycle due toward the end of October. So, the question is, will these bottoming cycles (and potentially others) be enough to keep the market in a downtrend, forming re-distribution levels along the way which will allow it to achieve a decline of intermediate proportion? That’s what we will need to do in order to preserve the reputation of the decennial pattern ending in seven!
Perhaps the four-year presidential cycle will come to the rescue. According to the proponents of that theory, history suggests that stock prices will be weakest in the second half of the first year, and the first half of the second year of the 4-year presidential cycle. We have entered that period of purported weakness, so let’s see if it holds up to the historical pattern.
Technically, the weekly indicators have improved slightly, while the daily have weakened but still have not given a sell signal. Actually, though helpful, it is not really necessary to know ahead of time when cycles will make their lows since technical indicators should warn of approaching strength and weakness, and P&F charts should tell us how much should be expected of each reversal.
Analysis: (These Charts and subsequent ones courtesy of QCharts.com)
Daily chart
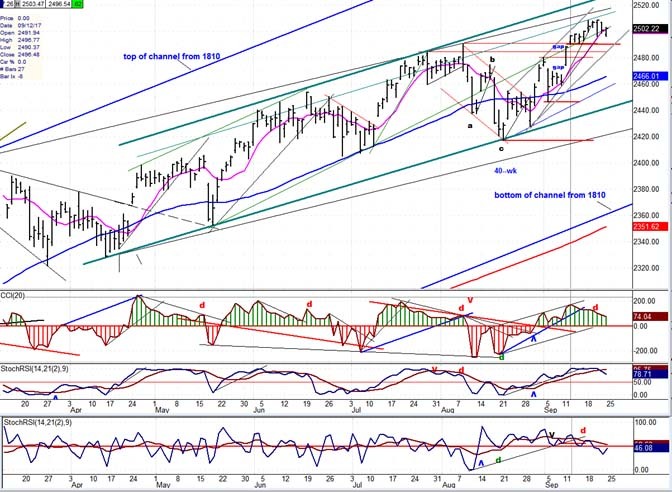
Here is the information we can derive from analyzing the daily chart of the SPX: By initially focusing on the larger blue channel from 1810, we can see that the intermediate trend is decelerating since the index has not been able to rise to the top channel line. On the other hand, the deceleration – often a precursor to a reversal -- is not severe enough to immediately challenge the bottom channel line which is still some one hundred and thirty points away.
The price action contained within the green channel shown on the chart tells us that the short-term trend is still alive and well since it rose to the top of the channel, but that makes it overbought and we can see that the oscillators at the bottom of the chart have started to roll over, warning that we can expect a correction to take place as soon as the index price breaks out of the last minor up-channel. That will probably correspond with the oscillators turning negative and giving a sell signal. If my assessment that a small cycle low is due in early October, we are looking at a decline which will last about two and a half to three weeks and, according to the degree of distribution at the current top, it should amount to about 50 points. That should bring us down to the vicinity of the lower green channel line, which could provide some support and, if met at the low of the cycle, possibly reverse the short term trend.
After that, we will need to see how much of a rally develops and what the indicators tell us. If our oscillators are sluggish and have difficulty getting back into an uptrend, we could be at risk of breaking through the lower channel line and extending the correction. If this should occur, by the time it happens another congestion pattern should have formed which will help us gauge the extent of the subsequent decline.
For now, unless we get some renewed strength early next week, the scenario depicted above should come to fruition. Now let’s move on to the hourly chart to see if we can add some refinement to this analysis.
Hourly chart
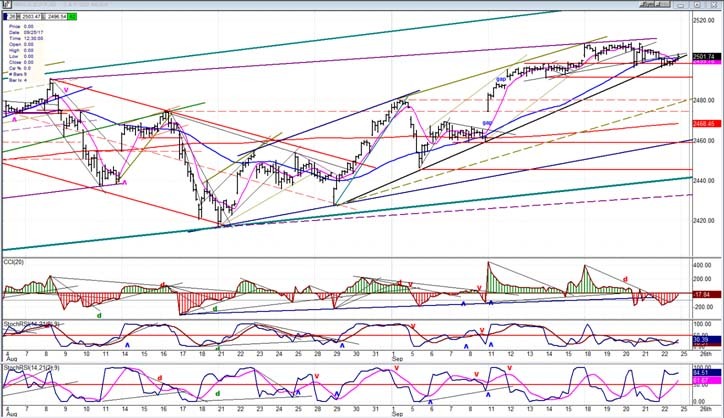
The hourly chart enables us to focus on the last phase of the rally, starting on August 21;talk about deceleration! But the index did manage to hold above the trend line on Friday, and even rally near the close, although there was some last minute selling. It’s obvious that as soon as the trend line gives way, the (red) minor support levels are likely to break as well. If so, the next support is at the dashed linesdrawn across the former tops. This is also where price will meet the greenish dashed channel line, and this could create a little halt in the decline.
The momentum oscillators have already given a sell signal, but with the daily still positive, they could not exert much downside pressure. Also, the A/Ds managed to stay positive -- a sign that some support buying was taking place.
In the course of the decline, the next lower trend line will also most likely be broken, but the green channel line (see daily chart above) may contain the entire decline, at least temporarily, since it will correspond to the projection target.
An overview of some important indexes (daily charts)
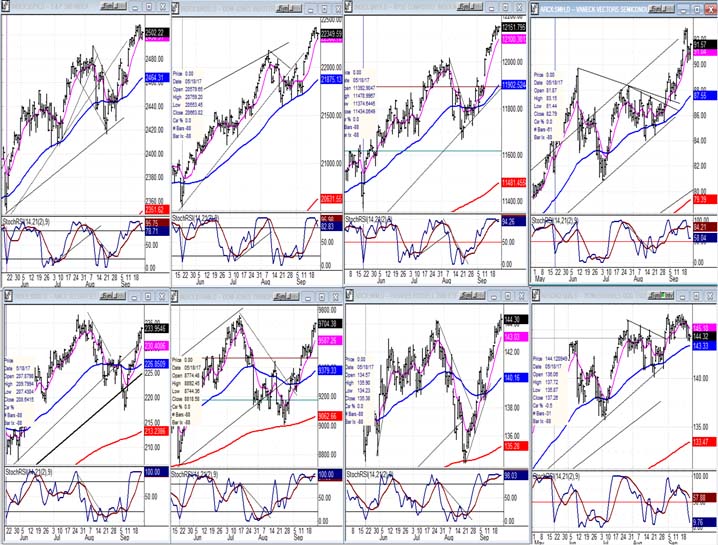
The overall condition of the various indexes below remains essentially the same, except for the obvious change of pace noticeable in the QQQ (bottom right) which had been one of the strongest. Still, this is not enough to warn us that some serious reversal is about to take place in the overall market.
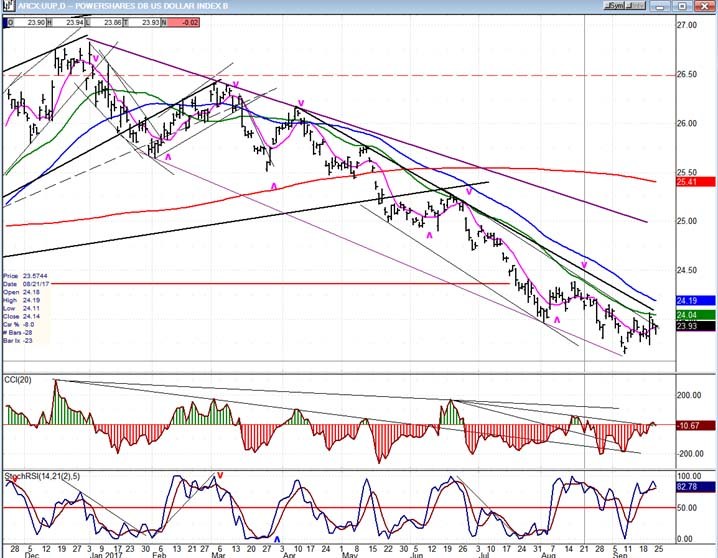
UUP (dollar ETF)
Continued weakness in UUP remains the primary condition of this index.
GDX (Gold Miners ETF)
GDX tried to reverse last week after a normal correction of about .382, but it was whacked by Wednesday’s FOMC report which increased its pull-back to 70% of the previous rally. While this does not foreshadow a return to an intermediate bearish trend, it could be a temporary set-back for an aggressive resumption of the bullish trend, even though this should now be the primary trend after the bottoming of the 8-yr cycle on 0/16. Over the near-term, however, higher prices should still be seen.
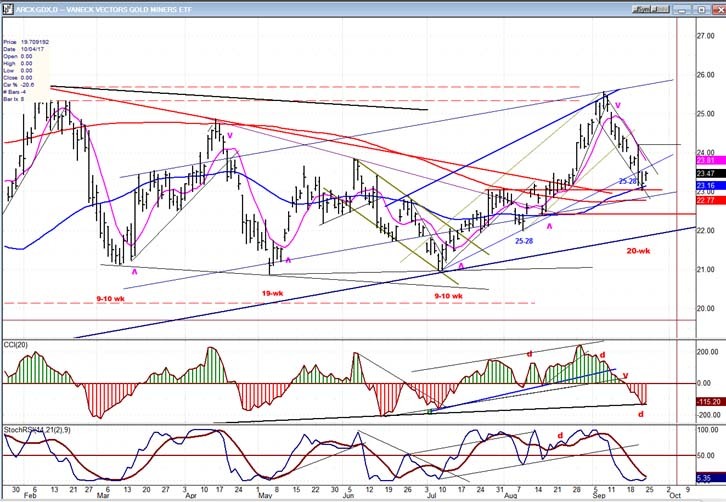
Note: GDX is now updated for subscribers throughout the day, along with SPX.Both, with their derivatives, are good trading vehicles, and you will receive detailed information on both.
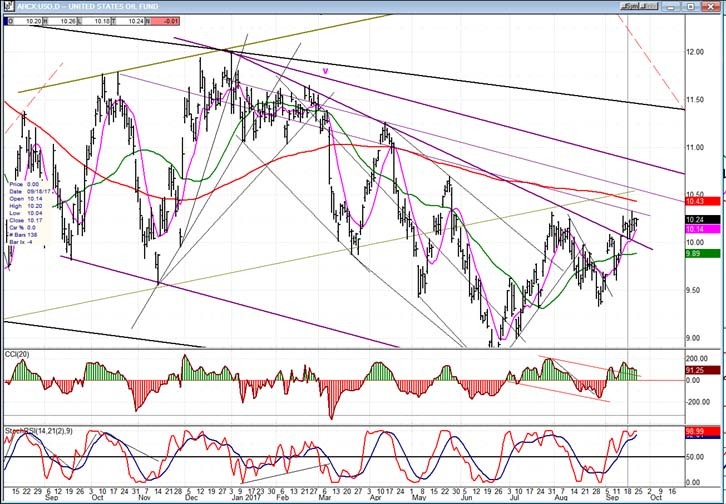
USO (United States Oil Fund)
USO has managed to move out of its secondary corrective channel, but it still faces a lot of overhead resistance which will hamper further upside progress.
Summary
Obvious deceleration taking place (and increasing) is a warning that a correction is beginning. At a minimum, it probably will be a short-term set-back for the SPX which should continue into early next month.
Author

Andre Gratian
Market Turning Points
When I was a stock broker years ago, a friend introduced me to technical analysis of the market and it is not an exaggeration to say that I fell in love with this approach! Ever since then, it has become an increasingly important


