Forex trading EUR/USD, AUD/USD pullback – Iran War rhetoric causes more WTI volatility [Video]
![Forex trading EUR/USD, AUD/USD pullback – Iran War rhetoric causes more WTI volatility [Video]](https://editorial.fxsstatic.com/images/i/aud-usd-002.jpg)
In today’s GCI Market Outlook, let’s take a look at Forex Trading on the NASDAQ, WTI Crude Oil, Gold, XAUUSD, Silver, XAGUSD, GBPUSD, AUDUSD, and EURUSD.
Yesterday, major Middle East governments asked Donald Trump to stop bombing Iran, to try to avoid more instability.
The White House appears to have complied, and we see a pullback in the recent strength of USD.
This bounce in EURUSD is common among all USD pairs, and analysts see the downtrend continuing from the break of this rising wedge.
We are seeing the same price action patterns and an overbought stochastic oscillator in AUDUSD and GBPUSD, with a longer way to fall as GBP has been weak recently, due to political instability.
I encourage you to check all USD pairs for similar opportunities.
And, we have all manner of economic news affecting GBP, CAD, USD, and AUD from Employment data to CPI, PMIs, and the FOMC minutes.
Speaking of Iran, we see some wild volatility, around $6 to be precise, on WTI based on the announcements yesterday.
If we move out to the daily chart, we see a symmetrical pennant and an overbought stochastic oscillator, so let’s hope the ceasefire sticks this time.
Any more good news, of course, will see both WTI and Brent Crude Oil falling.
Both gold and silver show the same price action as other USD pairs, and we note this key level of support on gold.
If we move out to the daily chart, we see a descending triangle where the same key level was resistance last December.
Be aware that we have a contradictory technical signal on the daily chart, but let’s face it, this is going to be a fundamental trade for the near future.
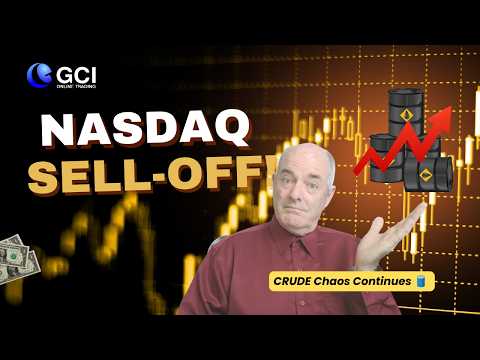
The uncertainty and high bond yields have hit the stock market, with indices like the NASDAQ in a steady sell-off.
Technically, we see bearish confluence in the stochastic oscillator and a clearly bearish MACD.
If we move out to the daily chart, we see price action well above the 200-day moving average, but the stochastic oscillator still looks bearish, and the MACD signal line is looking like it just might pop out of the histogram.
Author

Brad Alexander
FX Large Limited
Brad became fascinated with the Currency Markets from a young age and researched fundamental analysis.

















