Forex Metrics and Chart Week 47 / 2017

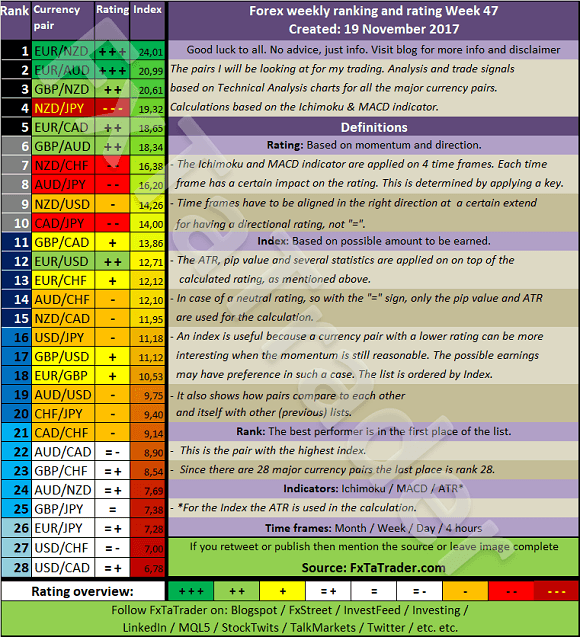
The Top 10 of the Ranking and Rating list for the coming week shows the following stronger currencies being well represented for going long: the EUR(3X) with the JPY(3X) followed by the GBP(2X). The weaker currencies are the NZD(5X) followed by the AUD(3X) and the CAD(2X).
By diversifying a nice combination can be traded in the coming week like e.g.:
-
EUR/NZD with the CAD/JPY
-
NZD/JPY with the GBP/AUD
______________________________
Ranking and Rating list
Analysis based on TA charts for all the major currency pairs. Good luck to all. No advice, just info. Every week the Forex ranking rating list will be prepared for the weekend. All the relevant Time Frames will be analyzed and the ATR and Pip value will be set.
____________________________
For analyzing the best pairs to trade looking from a longer-term perspective the last 13 weeks Currency Classification can be used in support.
This was updated on 12 November 2017 and is provided here for reference purposes:
Strong: EUR and CAD. The preferred range is from 7 to 8.
Neutral: USD, AUD and GBP. The preferred range is 4 to 6.
Weak: JPY, CHF and NZD. The preferred range is from 1 to 3.
When comparing the 13 weeks Currency Classification with the pairs mentioned in the Ranking List above some would then become less interesting. On the other hand, these pairs are at the top of the list partly also because of their volatility. It seems best to take positions for a short period then and take advantage of the high price movements.
With the FxTaTrader Strategy, these pairs are not traded because these would be trades in lower Time Frames than the 4 Hour chart. Nevertheless, they may offer good chances for the short term trader.
______________________________________
Currency Score Chart
The Currency Score analysis is one of the parameters used for the Ranking and Rating list which is published also in this article. The Currency Score is my analysis on the 8 major currencies based on the technical analysis charts using the MACD and Ichimoku indicator on 4 Time Frames: the monthly, weekly, daily and 4 hours. The result of the technical analysis is the screenshot here below.
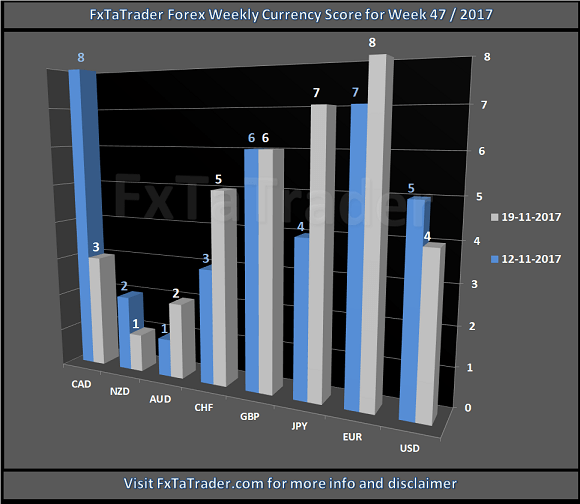
When comparing the 13 weeks Currency Classification with the recent Currency Score, as provided in the image above, we can determine the deviations. In the article "Forex Strength and Comparison" this is analyzed in more detail.
______________________________________
Chart of the Week
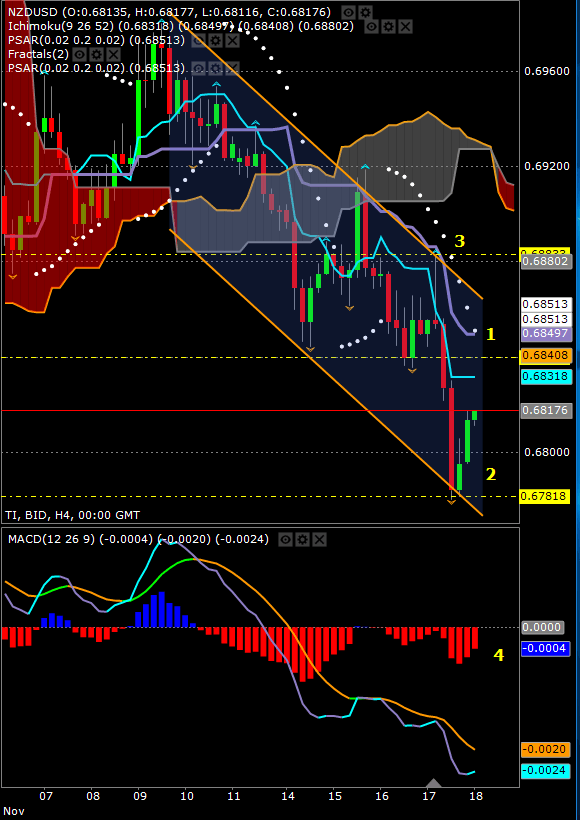
The Chart for this week is the NZD/USD 4 Hour chart.
Price is clearly in a downtrend and made a low lately at 0.6780. It is now consolidating above that level has currently a strong pullback nearing the Tenkan-Sen.
-
A nice sell opportunity would be around the Nr. 1 yellow dotted line and the Kijun-Sen. The yellow dotted line seems to be an important Support/Resistance level
The PSAR turned negative but may change to positive. It is however in favor of Short positions and as long as the PSAR in the Daily chart remains negative this set up remains valid.
By preference, the candlesticks should show a good pattern that confirms the entry. This could be e.g. one of the reversal Candlesticks patterns or a continuation pattern. Check e.g. the following links for more information: Bulkowski's Top 10 Reversal Candlesticks , Wikipedia Candlestick pattern or Investopedia Candlestick . -
The target should be above the Nr. 2 yellow dotted line where the latest low was made. This may be or become a support level and closing above that level is for that reason a good target.
-
In case of a stronger pullback with price going far above the Nr. 1 yellow dotted support line with the MACD not recovering the set-up is no more valid. A stop-loss should be placed above the Nr. 3 yellow dotted support line. Having a Stop Loss above an important recent Top seems a good idea. These are levels where Support or Resistance may reside too. In this case, it would be above the high of 17 November at 0,6883.
-
The MACD should show strength in the MACD minus Signal, these are the Blue and Red bars. Either the red bars should become larger or the blue bars smaller. The MACD should stay below the zero line.
-
This is a pair that fits best in Point 1 of the Comparison Table Guide. For more information read my other Weekly article called the "Forex Strength and Comparison".
-
The USD is a Neutral currency and the NZD is a Weak currency. The Currency Score Difference is 3.
The set-up mentioned remains valid as long as the pair remains in the Top 10 of the coming Weekly Ranking and Rating lists and continues to comply with the point of the Comparison Table Guide mentioned above.
______________________________________
Besides this article, I also use the Forex "Strength and Comparison" which is also available once a week on my blog. In that article, we look in more detail at the relative position of the currencies and pairs. We will look in more detail at the interesting pairs from a longer term perspective for trading in the Daily and Weekly chart. We will use the information from this article, "Ranking, Rating and Score", and analyze it further in more detail.
It is recommended to read the page "Currency score explained", "Introduction to the FxTaTrader Forex Models" and "Statistics and Probabilities" for a better understanding of the article. If you would like to use this article, then mention the source by providing the URL FxTaTrader.com or the direct link to this article. Good luck in the coming week.
______________________________________
DISCLAIMER: The articles are my personal opinion, not recommendations, FX trading is risky and not suitable for everyone. The content is for educational purposes only and is aimed solely for the use by ‘experienced’ traders in the FOREX market as the contents are intended to be understood by professional users who are fully aware of the inherent risks in forex trading. The content is for 'Forex Trading Journal' purpose only. Nothing should be construed as a recommendation to purchase any financial instruments. The choice and risk are always yours. Thank you.
Author

Frank Oznar
FxTaTrader
Technical Analysis of the trading markets has fascinated me since the early 1990's. I was then about 25 years old. During the years my studies and work made it possible to look into Technical analysis from an economic and a scientific point of view.


