Forex Metrics and Chart Week 36/2017

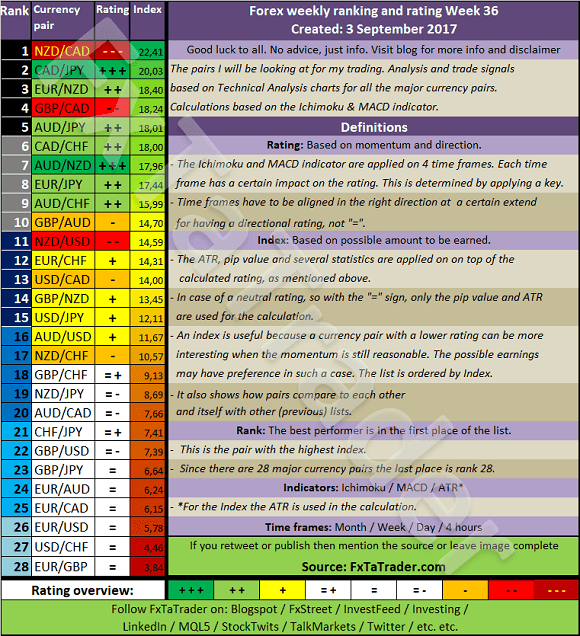
The Top 10 of the Ranking and Rating list for the coming week shows the following stronger currencies being well represented for going long: the CAD(4X) followed by the AUD(3X) and the EUR(2X). The weaker currencies are the NZD(3X) with the JPY(3X) followed by the CHF(2X).
By diversifying a nice combination can be traded in the coming week like e.g.:
-
NZD/CAD with the AUD/JPY
-
CAD/JPY with the EUR/NZD
______________________________________
Ranking and Rating list
Analysis based on TA charts for all the major currency pairs. Good luck to all. No advice, just info. Every week the Forex ranking rating list will be prepared for the weekend. All the relevant Time Frames will be analyzed and the ATR and Pip value will be set.
______________________________________
For analyzing the best pairs to trade looking from a longer-term perspective the last 13 weeks Currency Classification can be used in support.
This was updated on 3 September 2017 and is provided here for reference purposes:
Strong: EUR, AUD, NZD and CAD. The preferred range is from 5 to 8.
Neutral: JPY and CHF. The preferred range is 3 to 4.
Weak: USD and GBP. The preferred range is from 1 to 2.
When comparing the 13 weeks Currency Classification with the pairs mentioned in the Ranking List above some would then become less interesting. On the other hand, these pairs are at the top of the list partly also because of their volatility. It seems best to take positions for a short period then and take advantage of the high price movements.
With the FxTaTrader Strategy, these pairs are not traded because these would be trades in the 4 Hour chart or in a lower Time Frame. Nevertheless, they may offer good chances for the short term trader.
______________________________________
Currency Score Chart
The Currency Score analysis is one of the parameters used for the Ranking and Rating list which is published also in this article. The Currency Score is my analysis on the 8 major currencies based on the technical analysis charts using the MACD and Ichimoku indicator on 4 Time Frames: the monthly, weekly, daily and 4 hours. The result of the technical analysis is the screenshot here below.
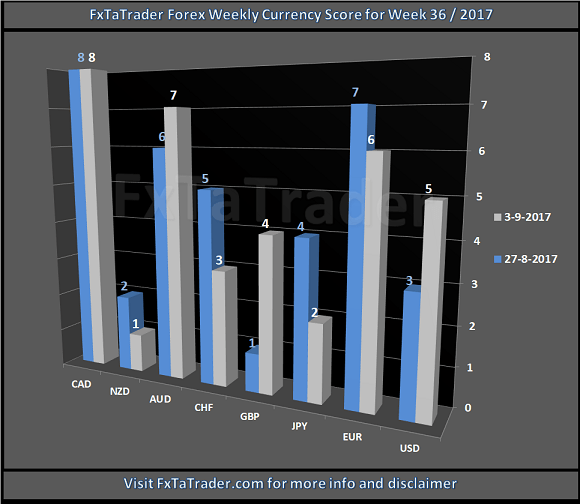
When comparing the 13 weeks Currency Classification with the recent Currency Score, as provided in the image above, we can determine the deviations. In the article "Forex Strength and Comparison" this is analyzed in more detail.
______________________________________
Chart of the Week
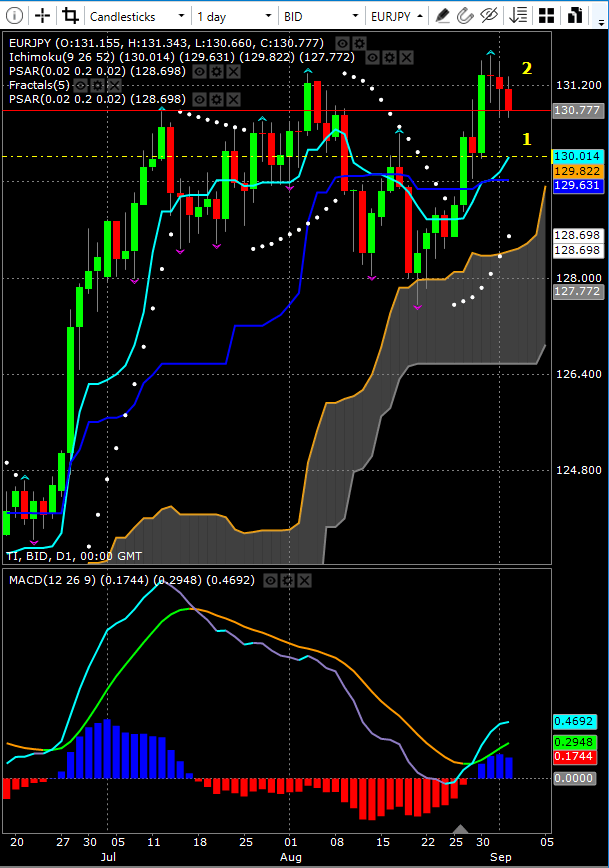
The Chart for this week is the EUR/JPY Daily chart.
Price is above the Tenkan-Sen and clearly in an uptrend, the pair is consolidating around the latest top and may have a pullback to the Tenkan-Sen. This is also the area where a lot of Open / Close / High and Lows can be found, see the yellow dotted line.
-
A nice buy opportunity would be around the level of the Tenkan-Sen at +/- 130 where Nr. 1 is.
-
The target should be below the latest high which is currently at 131,70 where Nr. 2 is. Even below the latest Open and Close of the highest bars at 131,38 offers a good range for making a profit.
-
The MACD is looking fine and as long as it does not cross the Signal line the set-up remains valid.
The 4H. and/or 8H. chart may offer good information for the entry price. There is a range of +/- 140 Pips from the levels discussed in point 1 to point 2 and taking profit there seems realistic.
-
This is a pair that fits best in Point 1 of the Comparison Table Guide which you can also read here below.
Better-classified currencies in combination with weaker-classified currencies can always be traded and vice versa. The Currency Score difference may be negative. In that case, the trade should be made after a pullback. In other words, a trade can then only take place after a recovery and the main trend being confirmed again. -
The EUR is a Strong currency and the JPY a Neutral currency. The Currency Score Difference is 4.
Author

Frank Oznar
FxTaTrader
Technical Analysis of the trading markets has fascinated me since the early 1990's. I was then about 25 years old. During the years my studies and work made it possible to look into Technical analysis from an economic and a scientific point of view.


