Forex Metrics and Chart Week 28 / 2017
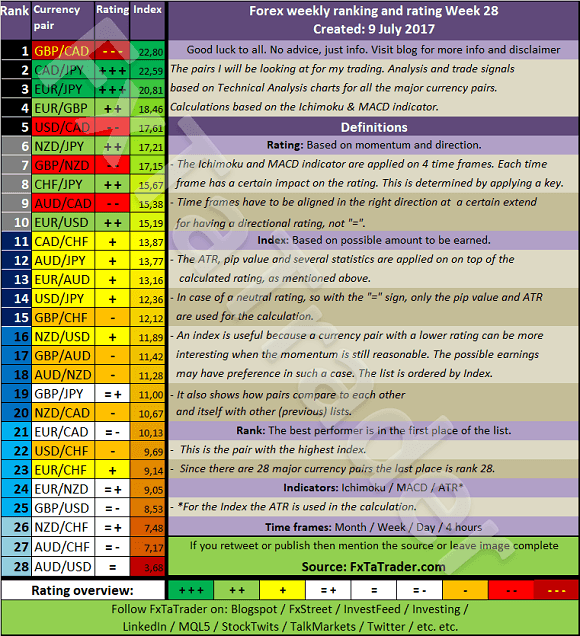
The Top 10 of the Ranking and Rating list for the coming week shows the following stronger currencies being well represented for going long: the CAD(4X) followed by the EUR(3X) followed by the NZD(2X). The weaker currencies are the JPY(4X) followed by the GBP(3X) and the USD(2X).
By diversifying a nice combination can be traded in the coming week like e.g.:
-
GBP/CAD with the NZD/JPY
-
CAD/JPY with the EUR/GBP
______________________________________
Ranking and Rating list
Analysis based on TA charts for all the major currency pairs. Good luck to all. No advice, just info. Every week the Forex ranking rating list will be prepared for the weekend. All the relevant Time Frames will be analyzed and the ATR and Pip value will be set.
______________________________________
For analyzing the best pairs to trade looking from a longer-term perspective the last 13 weeks Currency Classification can be used in support.
This was updated on 2 July 2017 and is provided here for reference purposes:
Strong: EUR, NZD and CHF. The preferred range is from 6 to 8.
Neutral: GBP, USD and JPY. The preferred range is from 3 to 5.
Weak: AUD, CAD. The preferred range is from 1 to 2.
When comparing the 13 weeks Currency Classification with the pairs mentioned in the Ranking List above some would then become less interesting. On the other hand, these pairs are at the top of the list partly also because of their volatility. It seems best to take positions for a short period then and take advantage of the high price movements.
With the FxTaTrader Strategy, these pairs are not traded because these would be trades in the 4 Hour chart or in a lower Time Frame. Nevertheless, they may offer good chances for the short term trader.
______________________________________
Currency Score Chart
The Currency Score analysis is one of the parameters used for the Ranking and Rating list which is published also in this article. The Currency Score is my analysis on the 8 major currencies based on the technical analysis charts using the MACD and Ichimoku indicator on 4 Time Frames: the monthly, weekly, daily and 4 hours. The result of the technical analysis is the screenshot here below.
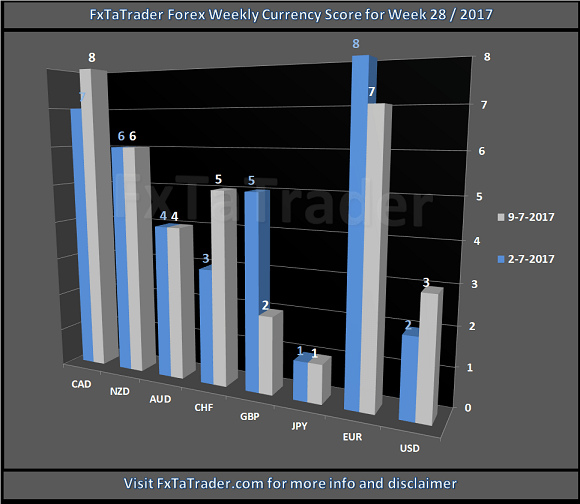
When comparing the 13 weeks Currency Classification with the recent Currency Score, as provided in the image above, we can determine the deviations. In the article "Forex Strength and Comparison" this is analyzed in more detail.
______________________________________
Chart of the Week
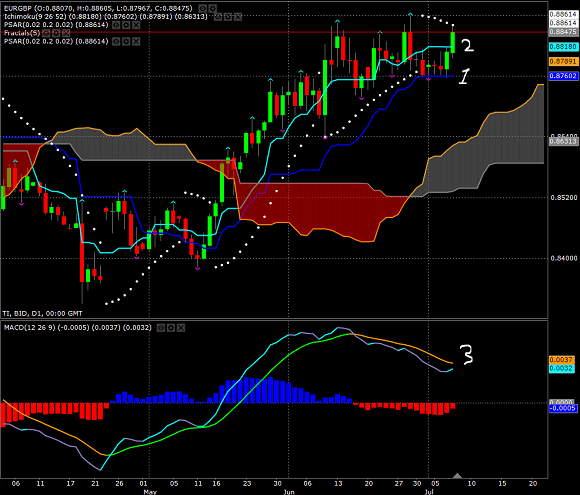
The Chart for this week is the EUR/GBP Daily chart.
-
Price found support in the area where the Kijun-Sen is at the moment.
This support was a resistance in the period end of May and begin of June.
There are many fractals (blue and purple arrows) showing significant highs and lows in that area. -
Price is now above the Tenkan-Sen but did not succeed yet to change the PSAR into a Long signal.
It is however close to doing so and a pullback after that may be a good entry opportunity for a trade in the upcoming week.
In that case the 4 Hour chart is the best one to use for the timing of the trade and a target below the recent Top seems realistic. -
The MACD is recovering and while it does so the rate may visit the most recent top.
-
This is a pair that fits best in Point 1 of the Comparison Table Guide which you can also read here below.
First of all better-classified currencies in combination with weaker-classified currencies can always be traded. The Currency Score difference may be negative. In that case, the trade should be made after a pullback. In other words, a trade can then only take place after a recovery and the main trend being confirmed again. -
The EUR is a Strong currency and the GBP a Neutral currency. The Currency Score Difference is 5 so the trend is strong.
For more information read my other Weekly article called the "Forex Strength and Comparison".
______________________________________
Besides this article, I also use the Forex "Strength and Comparison" which is also available once a week on my blog. In that article, we look in more detail at the relative position of the currencies and pairs. We will look in more detail at the interesting pairs from a longer term perspective for trading in the Daily and Weekly chart. We will use the information from this article, "Ranking, Rating and Score", and analyze it further in more detail.
It is recommended to read the page "Currency score explained", "Introduction to the FxTaTrader Forex Models" and "Statistics and Probabilities" for a better understanding of the article. If you would like to use this article, then mention the source by providing the URL FxTaTrader.com or the direct link to this article. Good luck in the coming week.
Author

Frank Oznar
FxTaTrader
Technical Analysis of the trading markets has fascinated me since the early 1990's. I was then about 25 years old. During the years my studies and work made it possible to look into Technical analysis from an economic and a scientific point of view.


