Forex Metrics and Chart Month February 2018
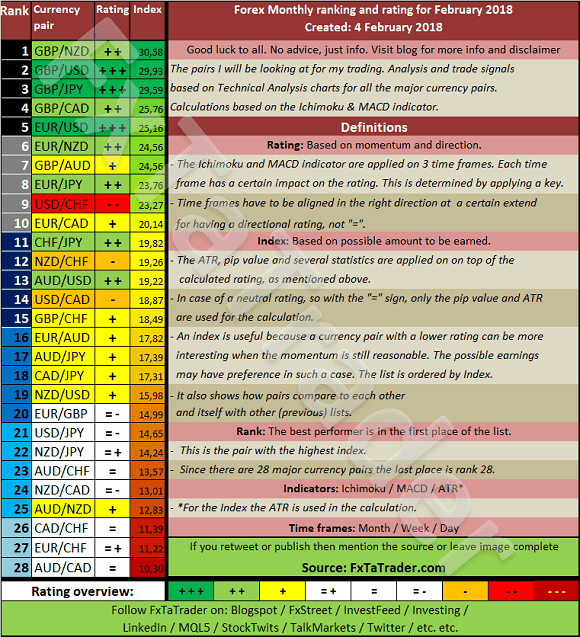
The Top 10 of the Ranking and Rating list for the coming month shows the following stronger currencies being well represented for going long: the GBP(5X) followed by the EUR(4X). The weaker currencies are the USD(3X) followed by the NZD(2X), JPY(2X) and CAD(2X).
By diversifying a nice combination can be traded in the coming month like e.g.:
-
GBP/CAD with the EUR/USD
-
GBP/JPY with the EUR/NZD
______________________________________
Ranking and Rating list
Analysis based on TA charts for all the major currency pairs. Good luck to all. No advice, just info. Every month the Forex ranking rating list will be prepared around the change of the month. All the relevant Time Frames will be analyzed and the ATR and Pip value will be set.
______________________________________
For analyzing the best pairs to trade looking from a longer-term perspective the last 12 months Currency Classification can be used in support.
This classification was updated on 4 February 2018 and is provided here for reference purposes:
Strong: EUR, GBP, AUD, CAD. The preferred range is from 5 to 8.
Neutral: USD, CHF. The preferred range is from 3 to 4.
Weak: JPY, NZD. The preferred range is 1 to 2.
When comparing the 12 months Currency Classification with the pairs mentioned in the Ranking List above some would then become less interesting. On the other hand, these pairs are at the top of the list partly also because of their volatility. It seems best to take positions for a short period then and take advantage of the high price movements.
With the FxTaTrader Strategy, these pairs are not traded because these would be trades in the 4 Hour chart or in a lower Time Frame. Nevertheless, they may offer good chances for the short term trader.
______________________________________
Currency Score Chart
The Currency Score analysis is one of the parameters used for the Ranking and Rating list which is published also in this article. The Currency Score is my analysis on the 8 major currencies based on the technical analysis charts using the MACD and Ichimoku indicator on 4 Time Frames: the monthly, weekly, daily and 4 hours. The result of the technical analysis is the screenshot here below.
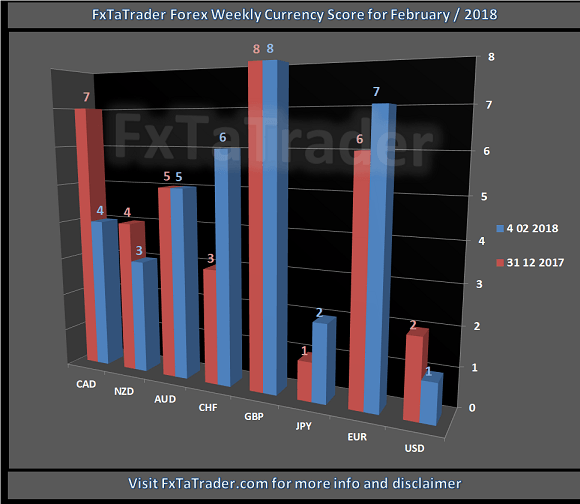
When comparing the 12 months Currency Classification with the recent Currency Score, as provided in the image above, we can determine the deviations. In the article "Forex Strength and Comparison" this is analyzed in more detail.
______________________________________
Chart of the Month
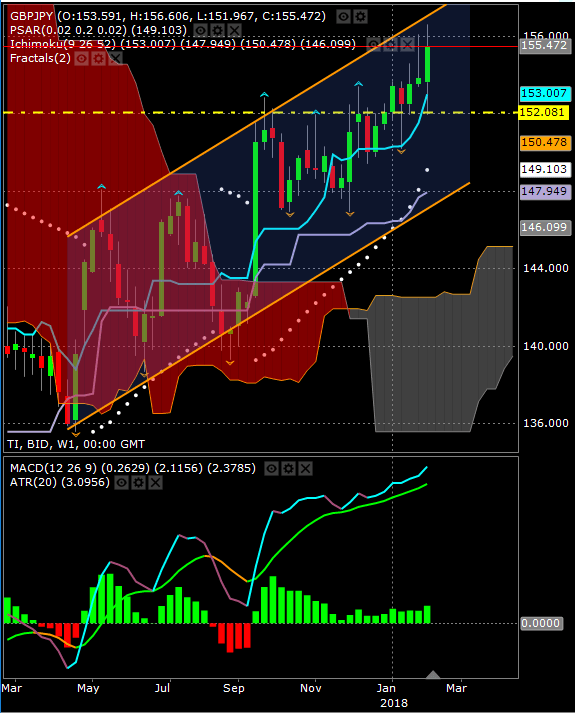
The Chart for this month is the GBP/JPY Weekly chart. Price is clearly in an uptrend and gaining momentum. Price broke last month through an important resistance level, see the yellow dotted line. This was a Support level in April, May and June of 2016.
A nice buy opportunity would be when the pair pulls back towards this support where the Kijun-Sen also is currently. The MACD shows a steady progress of the uptrend. As long as the MACD remains above the signal line and price remains above the Tenkan-Sen, Kijun-Sen and the Ichimoku cloud taking long positions seems a good opportunity.
Taking long positions on the Daily chart seems a good opportunity too. This can be done based on pullbacks towards the Kijun-Sen as explained in several set-ups of my previous articles.
-
This is a pair that fits best in Point 1 of the Comparison Table Guide. For more information read my other Monthly article called the "Forex Strength and Comparison".
-
The GBP is a strong currency and the JPY a Weak currency. The Currency Score Difference is 6.
The set-up mentioned remains valid as long as the pair remains in the Top 10 of the coming Monthly Ranking and Rating lists and continues to comply with the point of the Comparison Table Guide mentioned above.
Author

Frank Oznar
FxTaTrader
Technical Analysis of the trading markets has fascinated me since the early 1990's. I was then about 25 years old. During the years my studies and work made it possible to look into Technical analysis from an economic and a scientific point of view.


