|

Forecasting the rally higher for palladium

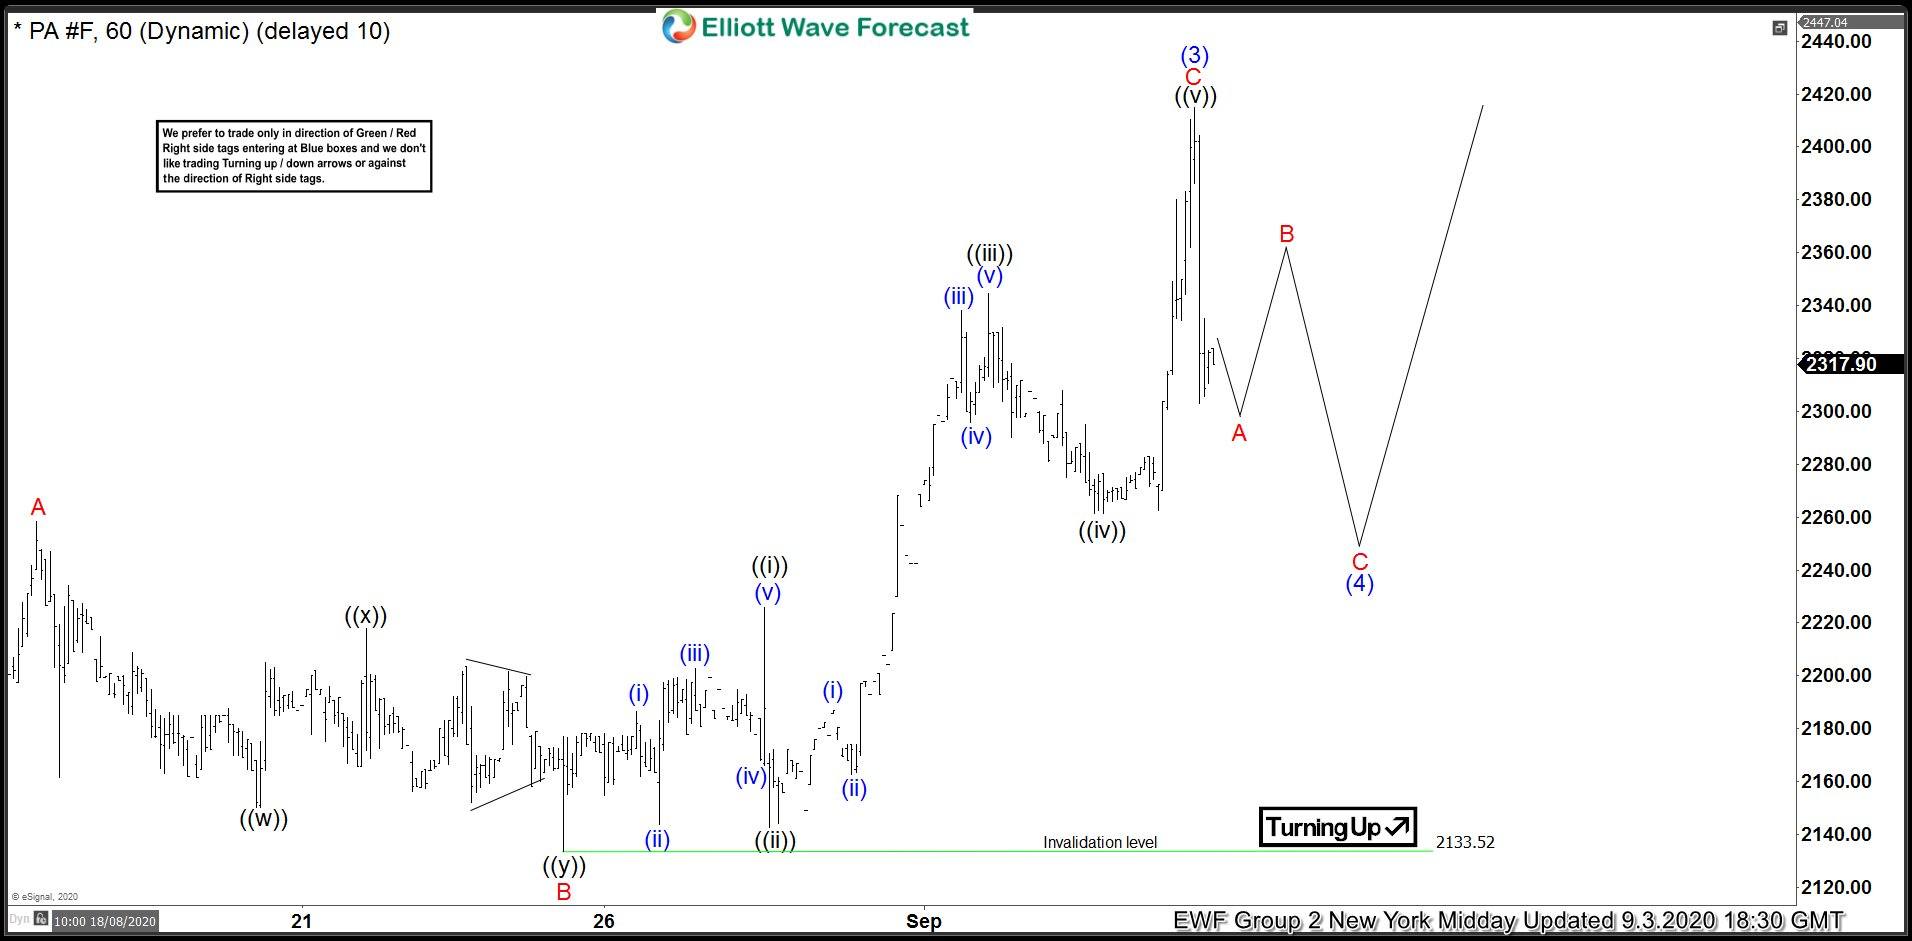
In this blog, we are going to take a look at the Elliott Wave chart of Palladium (PA_F). The 1 hour NY Midday chart update from September 3 shows that wheat has ended the cycle from August 12 low as wave (3) at 2415 high. Elliott Wave theory dictates that 3 waves pullback should happen afterwards before the rally continues. Therefore, Palladium is expected to do a pullback in wave (4), which could unfold as a zigzag correction or double three correction.

PA_F 9.3.2020 1 Hour NY Midday Elliott Wave Chart

Chart

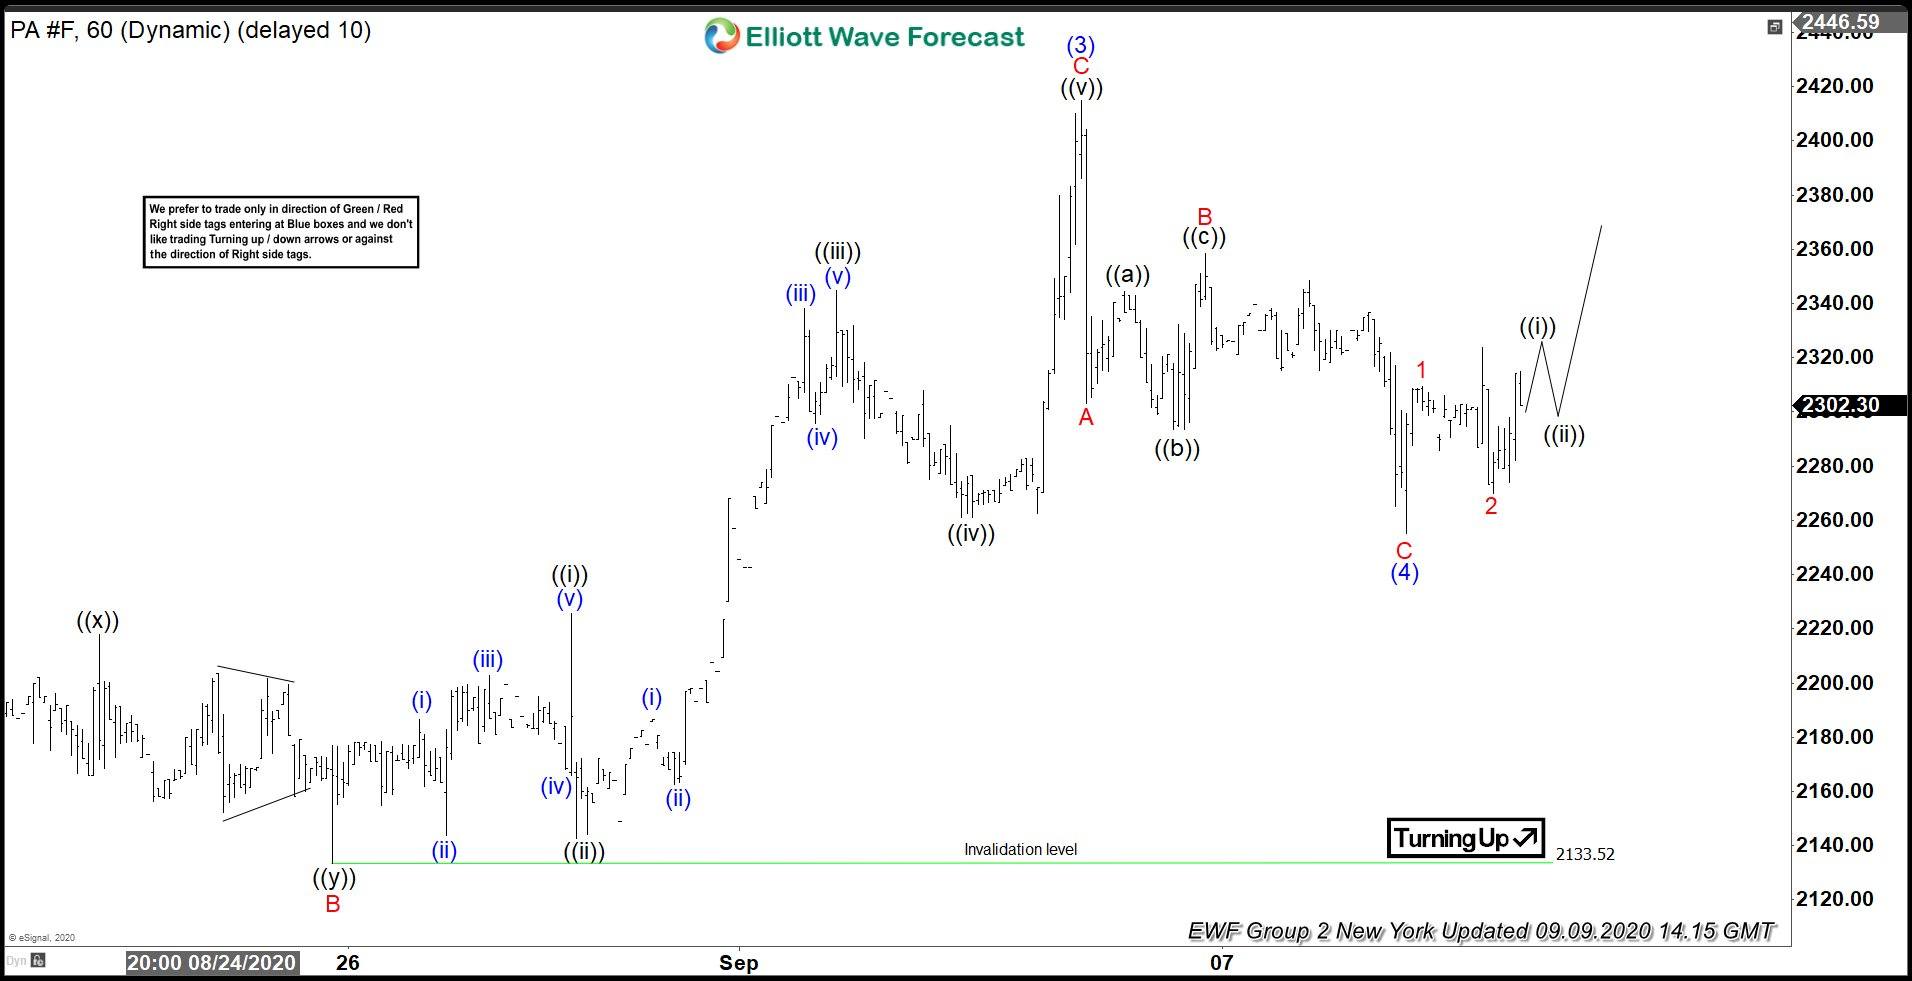
The 1 hour NY chart update from September 9 shows that Palladium has ended wave (4) pullback as a zigzag correction. Down from wave (3) high, wave A ended at 2303 low. Wave (B) bounce unfolded as a flat and ended at 2341.40 high. The metal then resumed lower and ended wave C at 2255.30 low. This final push lower also ended wave (4) in higher degree. As long as that low stays intact, then the metal can continue to resume higher. However, the metal still needs to break above wave (3) high to confirm that the next leg higher has started. Otherwise, wave (4) could still unfold as a double three correction before upside resume again.

PA_F 9.9.2020 1 Hour NY Elliott Wave Chart

Chart

The 1 hour Asia chart update from September 16 shows that Palladium continued to extend higher from wave (4) low. The rally has broken above previous wave (3) high, confirming that the next leg higher has already started and wave (4) low is in place. While above 2255.29 low, dips in 3,7, or 11 swings are expected to find support for more upside.

PA_F 9.16.2020 1 Hour Asia Elliott Wave Chart

Chart

Author

Elliott Wave Forecast Team

Elliott Wave Forecast Team

ElliottWave-Forecast.com

More from Elliott Wave Forecast Team
Share:

Editor's Picks

AUD/USD falls hard to test 0.7100 amid risk aversion

AUD/USD is under intense selling pressure in Friday's Asian trading, attacking the 0.7100 level. Broad risk-aversion amid US-Iran uncertainty, combined with weak Australian GDP data, weighs heavily on the higher-yielding Australian Dollar. All eyes now remain on the US NFP report for fresh impetus.

USD/JPY coiling up around 160.00 amid 'Yentervention' threats

USD/JPY sits glued near 160.00 in Asia on Friday, as the Japanese Yen remains supported by persistent 'Yentervention' threats by Japan's officials. However, the pair's downside remains capped by the Mideast tensions-led risk-off mood and the US Dollar's bullish consolidation.

Gold drops back toward $4,400 on US-Iran standoff, US NFP eyed

Gold price returns to the red and approaches $4,400 in the Asian session on Friday. The precious metal remains volatile amid ongoing geopolitical turmoil. Traders will closely monitor the developments surrounding the US-Iran peace deal and the US May employment report later on Friday. 


DeFi hack losses drop 80% from 2022 peak as security defenses improve — Immunefi

Losses from decentralized finance exploits have fallen by 80% since reaching a record high in 2022, according to a report released by Immunefi. The report, which analyzed exploit-driven losses across major blockchain ecosystems between 2020 and 2025, found that DeFi protocol losses declined from $2.62 billion in 2022 to $534 million in 2024.

Nonfarm payrolls: Testing the limits of Fed policy patience

The upcoming nonfarm payrolls report for May will provide the final update on the US labor market before Kevin Warsh attends his first policy meeting as the new Fed Chair later this month.

Recession on paper: What really moves the Canadian Loonie now?

Statistics Canada handed the headline writers a gift and the analysts a headache. Real GDP shrank 0.1% on an annualized basis in the first quarter, and with the fourth quarter of 2025 revised down to a 1.0% contraction, that is two negative quarters in a row, the textbook definition of a technical recession and Canada's first since the pandemic.