|

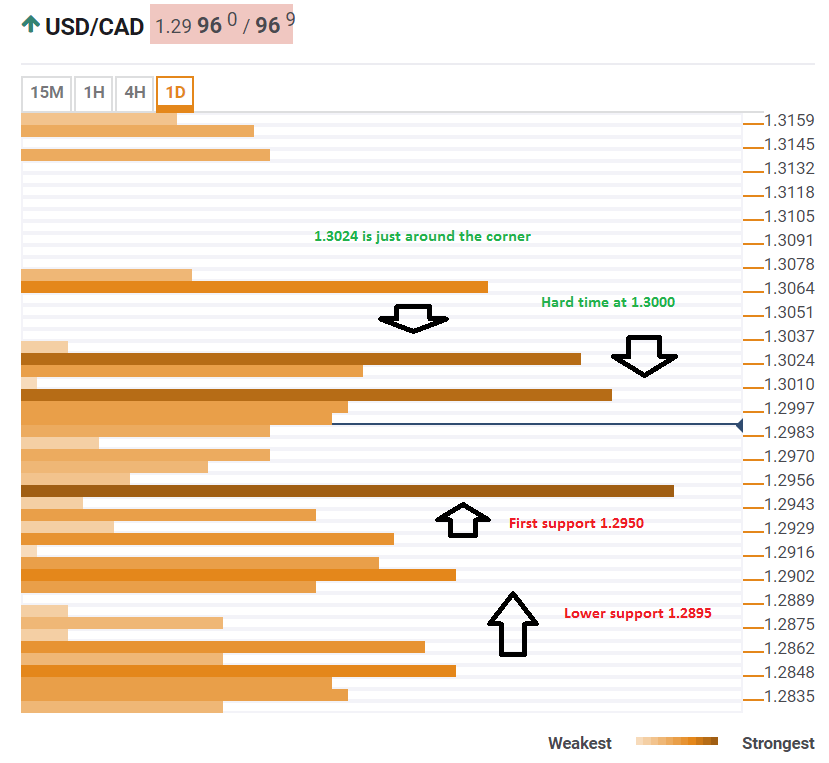
For USD/CAD, 1.3000 is more than a round number— Confluence Detector

In early May, the Technical Confluences Indicator showed that the USD/CAD would it hard to reach 1.3000 (USD/CAD to 1.30? Not so fast) and the pair indeed failed to do so. As the pair is very close t the round number, we see that there is much more to this level that a round number: it is also a dense cluster of resistance lines.

1.3000 is the confluence of the Bolinger-Band 15-m Upper, the BB 1h-Upper, the one-month high and the 4h high. Should the pair break higher, another convergence of levels awaits at 1.3024: the Pivot Point one-day Resistance 1, the Bolinger Band one-hour Upper, and the Pivot Point one-month Resistance 1. 

On the downside, Dollar/CAD has support at 1.2950 which is the confluence of the Fibonacci 38.2% one-day. the Bolinger Band one-day Upper, the Simple Moving Average 200-15m and the SMA 50-1h.  Further down, 1.2895 is the meeting point of the SMA 100-1h, the Fibonacci 38.2% one-week and the Pivot Point one-day Support 1.

Here is how it looks on the tool:

USD CAD Technical confluence levels May 28 2018

Confluence Detector

The Confluence Detector finds exciting opportunities using Technical Confluences. The TC is a tool to locate and point out those price levels where there is a congestion of indicators, moving averages, Fibonacci levels, Pivot Points, etc. Knowing where these congestion points are located is very useful for the trader, and can be used as a basis for different strategies.

This tool assigns a certain amount of “weight” to each indicator, and this “weight” can influence adjacents price levels. This means that one price level without any indicator or moving average but under the influence of two “strongly weighted” levels accumulate more resistance than their neighbors. In these cases, the tool signals resistance in apparently empty areas.

Learn more about Technical Confluence

Author

Yohay Elam

Yohay Elam

FXStreet

Yohay is in Forex since 2008 when he founded Forex Crunch, a blog crafted in his free time that turned into a fully-fledged currency website later sold to Finixio.

More from Yohay Elam
Share:

Editor's Picks

EUR/USD weakens as US jobs data trims Fed rate cut bets

The EUR/USD pair trades in negative territory for the third consecutive day near 1.1860 during the early European session on Thursday. Traders will keep an eye on the US weekly Initial Jobless Claims data. On Friday, the attention will shift to the US Consumer Price Index inflation report. 

GBP/USD bullish outlook prevails above 1.3600, UK GDP data looms

The GBP/USD pair gains ground near 1.3635, snapping the two-day losing streak during the early European session on Thursday. The preliminary reading of UK Gross Domestic Product for the fourth quarter will be closely watched later on Thursday. The UK economy is estimated to grow 0.2% QoQ in Q4, versus 0.1% in Q1. 

Gold remains on the defensive below two-week top; lacks bearish conviction amid mixed cues

Gold sticks to modest intraday losses through the Asian session on Thursday, though it lacks follow-through selling and remains close to a nearly two-week high, touched the previous day. The commodity currently trades above the $5,070 level, down just over 0.20% for the day, amid mixed cues.

UK GDP set to post weak growth as markets rise bets on March rate cut

Markets will be watching closely on Thursday, when the United Kingdom’s Office for National Statistics will release the advance estimate of Q4 Gross Domestic Product. If the data land in line with consensus, the UK economy would have continued to grow at an annualised pace of 1.2%, compared with 1.3% recorded the previous year. 

The market trades the path not the past

The payroll number did not just beat. It reset the tone. 130,000 vs. 65,000 expected, with a 35,000 whisper. 79 of 80 economists leaning the wrong way. Unemployment and underemployment are edging lower. For all the statistical fog around birth-death adjustments and seasonal quirks, the core message was unmistakable. The labour market is not cracking.

Sonic Labs’ vertical integration fuels recovery in S token

Sonic, previously Fantom (FTM), is extending its recovery trade at $0.048 at the time of writing, after rebounding by over 12% the previous day. The recovery thesis’ strengths lie in the optimism surrounding Sonic Labs’ Wednesday announcement to shift to a vertically integrated model, aimed at boosting S token utility.