FOMC says 'Fairly Soon'
Today's Highlights
-
FOMC says "Fairly Soon"
-
What is a Triangle?
-
Examples in Nature
Please Note: All data, figures & graphs are valid as of February 23rd. All trading carries risk. Only risk capital you're prepared to lose.
Market Overview
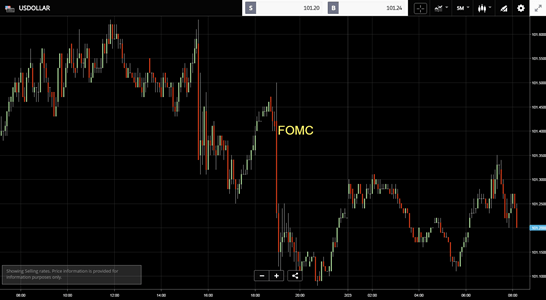
The FOMC meeting minutes poured a bucket of ice water on the markets. Instead of raising expectations for a rate hike in March, they have brought them down by using the less than enthusiastic statement "fairly soon" to describe the next rate rise.
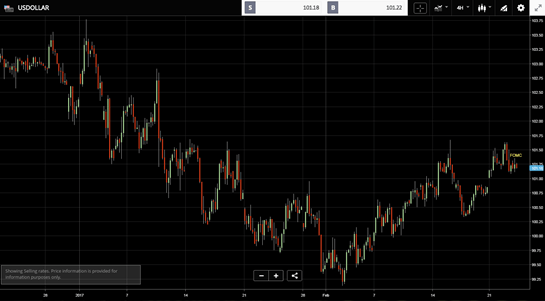
So even though we are in a rate rising cycle and we are on track for two or three more hikes this year, March now looks like less of an option. However, market expectations are still at 36%, better than one in three odds and there are still plenty of Fed speeches that will be made before the interest rate decision on the 15th.
The market reaction to the minutes was fairly swift but also insignificant when considering the bigger picture.
The US Dollar got dinged and the US stock markets lost some momentum.
Here's the Dollar index on a 5 minute chart.
If we zoom out though, we can see that this is simply a part of a larger cycle.
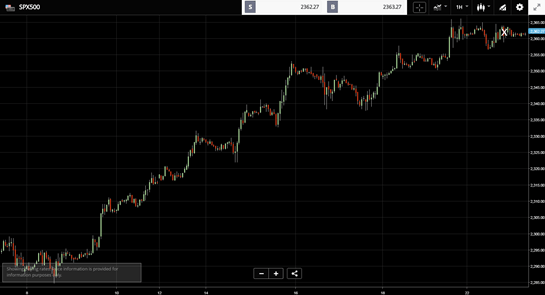
and here's the stock markets flying along before the FOMC took the air out from under their wings.
Let's get technical
Technical analysis is about finding patterns on the chart and exploiting them. Lately, there have been lots of patterns emerging.
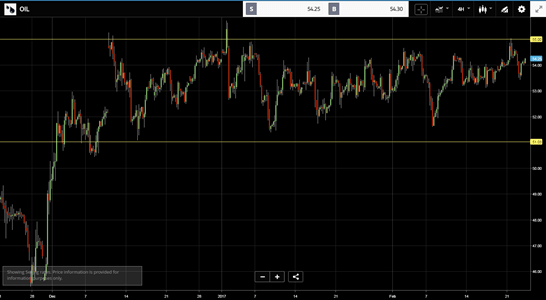
The most simple pattern is a range. This is what we've been seeing on crude oil over the past few months. There's a clear high point and a clear low, so traders know when to buy low and sell high.
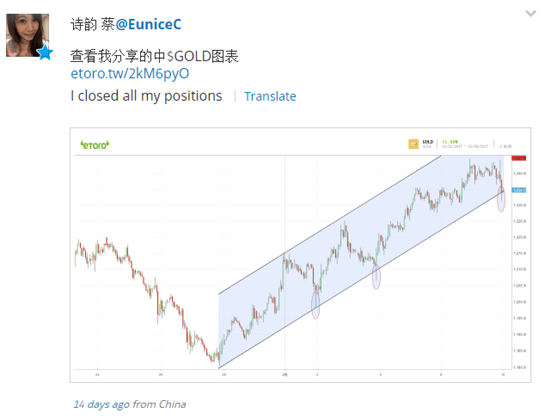
A channel is when you have a range that's moving up or down. Like this perfect example from @EuniceC.
A triangle is when you have a range or a channel that starts to close in. Meaning, the buyers gradually start accepting a higher price, and the sellers are lowering their offers over time.
On the chart, it looks like this.
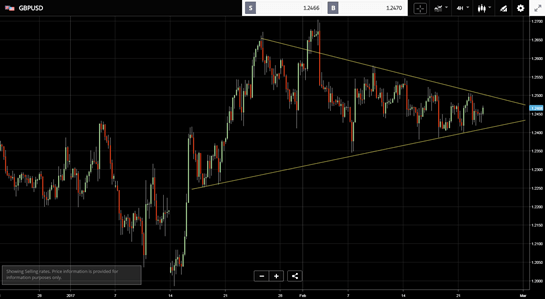
This pattern can provide some excellent trading opportunities, but they do dwindle over time. As the range gets smaller, the predictability increases but the profit margins eventually get too small to make it worth it.
The eventuality of any triangle is a breakout. Many times the direction of the breakout can help us determine the direction of the next trend in the market.
Now, let's play a game!
This game is open for anybody who wishes to play including everybody who works in eToro, premium clients, and members of the press who are sharing my work on a daily basis.
Please check around now and see if you can spot some of the above patterns in the markets. There are plenty of them out there at the moment.
Go ahead and post them on my wall @MatiGreenspan
I would love to see who's paying attention and enjoying the daily market updates and I really hope that my wall will be full of posts. :)
Have an awesome day ahead!
Author
_XtraSmall.jpg)
Mati Greenspan
eToro Cyprus
Producing social finance marketing materials by E-mail, blogs, and videos. Project manager for the eToro Blog Site, assisting paid users to submit content. Assisting VIP clients to deposit and manage portfolios of ov


