FOMC Grapples with Inflation Drivers
As the FOMC concludes its meeting this week, policymakers are facing a conundrum that must seem all too familiar: below target inflation amid continued tightening in the labor market. What is going on?
Drivers of Inflation: Supply vs. Demand Side
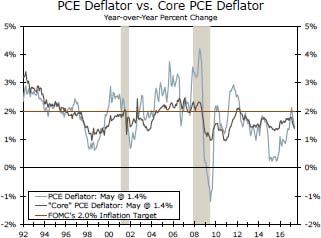
As the FOMC concludes its meeting this week, policymakers are facing a conundrum that must seem all too familiar: below target inflation amid continued tightening in the labor market and steady economic growth. Inflation started the year on a strong note, as the core PCE deflator reached 1.8 percent year-over-year in January, the highest since October 2012 (top chart). Since then, however, both headline and core inflation have trended lower despite an unemployment rate that is below the median FOMC estimate for the longer run. What is going on?
While economists agree as to why inflations matters, there is less consensus around the drivers of inflation. There are several theories of inflation, and each theory suggests somewhat different drivers. Over the years, different theories have fallen in and out of favor depending on long and short run considerations and how adequately each theory fits with the current inflationary environment. The Phillips Curve relationship is one theory that is often attached to monetary policy decision-making. In short, this theory posits that greater demand drives unemployment lower, and, as the labor market tightens, higher aggregate spending pulls up prices.
The Phillips curve framework famously broke down in the 1970s amid "stagflation," or rising inflation and unemployment. This seemingly paradoxical outcome ignored "cost-push" inflation, or inflation driven by changes on the supply side (in the 1970s, the shock from oil). Cost-push inflation can work in both directions. In the late 1990s, for example, rapid productivity growth and globalization helped keep inflation from surging despite robust economic growth. Real GDP growth averaged 4.7 percent from 1997 to 1999, yet core PCE inflation averaged just 1.4 percent.
Supply Side Takes Over?
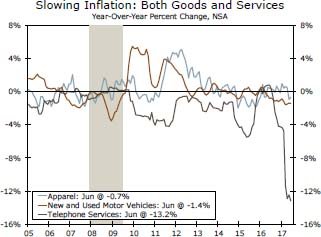
One possible explanation for the recent inflation conundrum is that the supply side has taken on a greater role of late. Competitive price pressures in wireless telephone services have been widely noted, as have the ongoing challenges and price wars in the retail and automotive sectors (middle chart). The oil supply glut has remained in place, and rents are now also decelerating as a surge in the supply of apartments is being delivered to many housing markets.
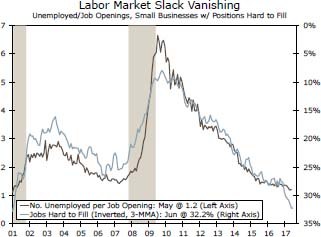
Furthermore, the demand side drivers of inflation do not operate like a light switch. It may take time for employers to adjust to this new equilibrium of scarce labor and alter wages in a meaningful way that clears the market. Record high job openings and reports that positions are hard to fill provide evidence that employers are working through this disequilibrium now, although structural issues related to the skills gap are likely also at work (bottom chart). For the FOMC, its participants are forced to ask not just how much slack remains in the labor market, but to what extent the demand side is even in the driver's seat in the first place.
Author

Wells Fargo Research Team
Wells Fargo


